Thursday, April 10, 2014

Update on Ebola virus disease (EVD) case accumulation chart with new WHO African Regional Office data...[UPDATED].

UPDATED with 2 Sierra Leone probable deaths.
Click on image to enlarge
Not much of a change to be seen with the data from WHO following that from UNICEF yesterday.

No Species Zaire ebolavirus cases have been confirmed in Sierra Leone nor any in Mali (6 suspected cases however; 2 other samples tested negative) or elsewhere. 


Click on image to enlarge.
Maps purchased from maptorian and adapted by VDU
EVD cases are still restricted to Guinea and Liberia and all cases remain linked to infections in Guinea. 

As I understood the recent WHO virtual press conference, because the index case was known, the transmission chain of contacts is mostly already under observation. While Ebola virus disease (EVD) has a grisly progression, once experts are in place to help track, test and educate, with the help of local and international governments, the spread of EVD can be contained. 

But it will still take time to be sure the outbreak has been contained; 2 full incubation periods worth of time.[3] As the maximum incubation period is 21-days (2-21 days being the full range), you start to see why the WHO speaks in terms of "months" [2,3] before the outbreak can be considered over. And that clock starts sometime around the end of the last case's disease onset I'd guess.


“We fully expect to be engaged in this outbreak for another two, three, four months”
Dr Kenji Fukuda, WHO[3]

So as the outbreak comes under control, as seems to be the case, we should pay attention to when new cases stop appearing. Then it becomes about waiting until everyone can safely say there are no new cases.

The most recent case had an onset of illness on 08-April-2014.

Sources...
  1. WHO-AFRO Ebola virus disease, West Africa (Situation as of 10 April 2014)http://www.afro.who.int/en/clusters-a-programmes/dpc/epidemic-a-pandemic-alert-and-response/outbreak-news/4093-ebola-virus-disease-west-africa-10-april-2014.html
  2. Ebola expected to terrorise West Africa for ‘months’–WHO - Euronewshttp://www.euronews.com/2014/04/09/ebola-expected-to-terrorise-west-africa-for-months-who/
  3. Officials Say Ebola Outbreak Could Last Months - Timehttp://time.com/54299/officials-say-ebola-outbreak-could-last-months/

Wednesday, April 9, 2014

Update on Ebola virus disease (EVD) case accumulation chart with new UNICEF data...

Click on chart to enlarge.
Thanks to a UNICEF Australia's update I've added a few cases to the produce a new chart; I expect we'll see some WHO numbers soon, and I'll update if there are any differences.

Check the version number in the bottom left hand corner - it defines whether it is the only chart of the day from VDU, or one of several.

The new version shows the proportion of fatal cases holding fairly steady at ~60% of all cases. This calculation includes those cases that also that look like EVD but have not been laboratory confirmed as EVD, as well as those that have been confirmed.

As I went into yesterday, these are very volatile numbers, so regard this chart for its trends only.

Sources...

  1. UNICEF Australia's PDF of numbers from ~3-hours ago
    http://ow.ly/d/24bM

Recorded Ebola virus disease (EVD) outbreaks throughout time...

A guide of case total confirmed cases and those who died from 
Ebola virus over time.
Sourced from Public Health England website [1]:
Click on chart to enlarge.
A quick chart to highlight the larger and smaller outbreaks and importations of EVD and Ebola viruses, respectively, that have been recorded worldwide since 1976.

I've added in the current tally of 167 suspected/probable/confirmed cases for the 2014 Guinea outbreak but this number is inflated compared to the other entries on the chart because those are reportedly based on confirmed cases; only around a third (59) of Ebola cases in the current outbreak have been confirmed to date.

Thanks to @Pawixx for steering me to the PHE page.

Please note that these numbers differ a little from the World Health Organization's Table [2]. Solving that discrepancy is a problem for another day.

Source...

  1. http://www.hpa.org.uk/Topics/InfectiousDiseases/InfectionsAZ/Ebola/GeneralInformation/
  2. http://www.who.int/mediacentre/factsheets/fs103/en/

Tuesday, April 8, 2014

Ebola virus disease and lab testing...

Virology Down Under's latest Ebola virus case case chart.
Click on chart to enlarge.
Maia Majumder has posted a nice concise comment on her blog. In her latest post [1] she notes that we shouldn't be too surprised that the number of Ebola virus disease (EVD) cases with a lab confirmation (conf) represent a relatively low proportion of the total cases we hear about. 

Currently (see the chart above), 35.3% are lab confirmed. That's 59 confirmed among 167 cases; the remainder are suspected [susp] or probable [prob] cases.[3]

What might contribute to the speed of laboratory confirmation in this and other EVD outbreaks? 

Some thoughts below:
  • Obtaining a specimen. If a body has already been hidden, buried or otherwise disposed off before a sample can be collected. Sampling may have been refused by next of kin-although I am not at all sure if that is a "thing"  during an EVD outbreak
  • The need to work under enhanced safety conditions to prevent laboratory-acquired infections. BSL4/PC4 not strictly available to the field labs (although they are setup to work with those pathogens; see Tweet below), but increased care and awareness still slows down the diagnostic process compared to testing for a much less fatal virus
  • The generally tough conditions for doing precise and careful lab work in a mobile laboratory; work that is often resource-, temperature- and power-sensitive not to mention fiddly and in need of well-controlled experimental conditions
  • Distance from the site of collection to qualified lab and the quality of sample once it reaches that lab. A sample that sat around in the sun or was accidentally frozen, lost, broken, sent to the wrong place, may be falsely or weakly negative requiring further testing
  • The case is positive for a different virus but one that causes similar signs and symptoms. This may also require additional testing to identify. Other virus testing may be run in parallel..or may not
  • You could argue that previous outbreaks used older and often much slower diagnostic methods. That's true, if you compare them side-by-side in a results race. In practice, PCR-based testing comes with lots of extra "bits" that can slow down the production of a final result. The process is still faster than things used to be, quite possible more  sensitive too, but still not as fast as we'd all like. Apples and oranges though.

What defines a suspected case requiring testing anyway? 

Pretty much the same things that define this for any outbreak; a suspected case is a person with the appropriate signs and symptoms of disease, who was in the right place at the right time to have come into contact with a known infected human or animal in such a way that they may have exposed themselves to virus, but they have not yet received a lab confirmation that they have that virus. It may be that a case never receives that confirmation because of a lack of positive specimens (don't have specimen or cannot get a positive result) in which case the person becomes a probable case if they meet the clinical criteria but cannot be confirmed. 

Why would a sample not be collected? 

As noted above, perhaps the next of kin did not allow samples to be collected, perhaps the body was disposed of before sampling could be achieved or perhaps the lab testing failed. To safeguard against the latter, PCR-based testing (not the only method) usually involves multiple assays, running replicates of each sample, and using several assays, each preferably targeted to a spatially different region of the viral genome to overcome the negative impact of any genetic changes in relying on a single site. Such viral genetic change may be an issue during a new outbreak. We haven't seen much by way of sequence analysis from any viral detections to date, but very early on in this outbreak the species was confirmed using genetic sequence determination, to be a strain of the species Zaire ebolavirus.

The numbers are constantly changing.

After all that, even a probable case may still get be discarded after lab test results are in; it may have been a suitably relevant disease, but caused by infection with a completely different virus.

While I think many of us understand that the numbers do change, I also think some of the interest we have in wanting to see them is to understand which way the trends are changing; up, down, steep, flat etc. There has been a fair bit of cautioning about the numbers. In my own defence, these numbers are real. They are collected by people on the ground. They are a much better metric to watch, changeable or not, than the many headlines and blogs and Tweets that may be more aimed at attracting readers and followers, or just be ill- or uninformed.

So the numbers change. What does that mean? As it stands, the Sierra Leone cases have now been taken off the Ebola tally because they were confirmed as haemorrhagic fevers due to a completely different virus; Lassa virus. A suspected EVD case in a child tested negative in Ghana. 2/6 suspected cases from Mali have also tested negative for the Zaire ebolavirus. The Liberian hunter thought to be an isolated EVD acquisition [8,9,10] not linked to Guinea, has now tested negative for the virus. So the numbers change quickly. That's your proof and it confirms what WHO's Gregory Haertl has been saying since Day 1 of this outbreak. These changes have effects too.

The fatal case percentage may rise despite more cases testing negative.

Not as strange as it sounds.

If the number of susp/prob cases drops as some are discarded because the lab confirms they are not EVD, the proportion of cases that are confirmed and died due to EVD will "look" larger-it will be a bigger percentage. The proportion of fatal cases currently sits around 63% of all susp/prob/conf cases now (up from a lowest point of 59%, down from a high of 72%). If the denominator (total susp/prob) cases should shrink while the numerator (fatal EVD cases) remains steady, or grows, the ratio will grow. Be prepared for that and the accompanying headlines or poorly informed Tweets and comments that will scream "the virus is mutating" blah blah blah. It probably isn't. It probably won't. But you may not get that message from using Google alone (try the links below and work your way up).

This EVD outbreak is proving especially challenging.

The term "challenging" seems to have become an agreeable descriptive for both the WHO and MSF, at last, as of yesterday's WHO virtual press conference[5]

The challenges that differentiate this Ebola outbreak from previous mostly seem to be about the wide spread of cases around the countries of both Guinea and Liberia, complicated by the presence of other pathogens that cause clinically similar diseases. More usual problems for tracking, identifying and confirming EVD cases are listed above including working under the requirements of enhanced safety and the need to bring in many essential resources. Careful and accurate confirmation of cases by the lab is a time-consuming process but one that must be given that time in order to ensure it gets the right result. False-negative results or lab-acquired infections would be a very bad outcome at any time but especially if resulting from an unnecessarily rushed testing process. False-positive results have an arguably larger negative impact on the entire situation. Timeliness is a very subjective thing. But lab confirmation is most definitely not like making a cup of coffee.

Can we see the forest for the trees yet?

The most recent EVD susp/prob/conf cases became symptomatic on 06-April-14, but no new healthcare workers were among them and some cases are now being discharged .[4] Some good news there.

We're obviously not out of the woods yet (pardon the pun) in terms of transmission chains. The WHO suggests it will be "some months" before we stop seeing cases. But the recent WHO virtual media conference stressed that while EVD is a serious disease it is one that can be controlled and the risk of infection is low, when the right precautions are in place.[5]

See the latest WHO-AFRO Ebola in Western Africa Situation Update also. It's got totals and charts!! Bloomberg quicktake webpage [6] and the US CDC webpages [7] have lots of digestible information too.

References...
  1. #Ebola2014: On the Topic of Lab-Confirmation
    http://maimunamajumder.wordpress.com/2014/04/08/ebola2014-on-the-topic-of-lab-confirmation/
  2. WHO-AFRO Ebola virus disease (EVD), West Africa Situation Report 07-Apr-14.
    http://www.afro.who.int/en/clusters-a-programmes/dpc/epidemic-a-pandemic-alert-and-response/outbreak-news/4089-dashboard-ebola-virus-disease-in-west-africa-07-april-2014.html
  3. WHO GAR DON Ebola virus disease (EVD), West Africa Update 07-Apr-14
    http://www.who.int/csr/don/2014_04_07_ebola/en/
  4. SUCCESSES AND CHALLENGES IN RESPONSE TO GUINEA EBOLA EPIDEMIC
    Médecins Sans Frontières Press Release 08-Apr-2014
    http://www.msf.org.au/media-room/press-releases/press-release/article/successes-and-challenges-in-response-to-guinea-ebola-epidemic.html
  5. Audio file for WHO virtual press Conference
    http://terrance.who.int/mediacentre/presser/WHO-RUSH_Ebola_outbreak_Guinea_presser_08APR2014.mp3
  6. Bloomberg's QuickTake on Ebola
    http://www.bloomberg.com/quicktake/ebola/
  7. The US Centers for Disease Control and Prevention on Ebola in West Africa, 2014
    http://www.cdc.gov/vhf/ebola/outbreaks/guinea/
  8. Liberia reports suspected Ebola outbreak unconnected to Guinea
    http://news.yahoo.com/liberia-reports-suspected-ebola-outbreak-unconnected-guinea-130714958.html
  9. LIBERIA: Ebola Deaths Rise In Liberia, Health Minister Confirms
    http://www.gnnliberia.com/articles/2014/04/05/liberia-ebola-deaths-rise-liberia-health-minister-confirms
  10. Liberia: An isolated Ebola case
    http://crofsblogs.typepad.com/h5n1/2014/04/liberia-an-isolated-ebola-case.html

Editor's Note #17: 500th post

Just noticed that there are 500 posts listed on this blog (501 now). I still have a few to port across from the old site but its kinda weird to think I've posted on stuff that many times. I only have ~60 actual scientific papers...although a lot more citations for VDU's blog than for those papers. Hmm. What does that say about my impact or chosen profession?

Anyhoo - Cool bananas!

I wasn't planning on blogging again for a while but Ebola has drawn me back for a little bit. 

Sunday, April 6, 2014

Ebola virus disease (EVD) outbreak in West Africa: chart of cases to 04-Apr

Data are based on WHO DONs, French Embassy Conakry
 figures and WHO Tweeted information.
Click on image to enlarge.
The Ebola virus disease (EVD) case chart adjacent is based on the latest Disease Outbreak News (DON) from the World Health Organization (WHO) posted at the Global Alert and Response (GAR) site [1] and at the African Regional Office (WHO-AFRO) [2].

There are roughly 163 suspected, probable and laboratory-confirmed cases including 95 deaths (58.3% proportion of fatal cases) for which only 56 (34.4%) have been confirmed by laboratory tetsing.

I'm also maintaining a curated Storify timeline here which lists some key Tweets and links on this outbreak. 

A few things to note about the chart and the outbreak:

  1. The susp/prob/conf (shorthand I use on Twitter) numbers change - the 1st 2 numbers can go down as well as up as cases that cannot be laboratory confirmed as due to EVD are discarded from the tally. Other diseases with similar presenting signs and symptoms occur in the West African region so this is not at all unexpected. We see the same thing for other viral outbreaks, like influenzavirus, all the time.
  2. The WHO does not posted "grand totals". The DONs present totals for each region (currently Guinea, Sierra Leone and Liberia), which I've tallied up above.
  3. Its worth remembering that this outbreak was happening back in early Feb, so there was a passage of time during which people were exposed and did not know precisely what was causing illness. This creates a lag between the time of the first announcement and when the situation can come under some semblance of control. Control requires that the various teams arrive, are coordinated and set up in the area to test, trace, educate and reduce virus spread. Each time a new region has a case, the same flurry of activity may well ensue, so case numbers will seem suddenly spike - but as we can see, they do not continue to rise exponentially, or even at all in some regions. This is thanks to the expert teams including those from the WHO, jurisdictional Ministries of Health, UNICEF, the Red Cross and Médecins Sans Frontières (apologies to all those I've missed - you are all doing a fantastic job under extreme conditions and you are extremely  appreciated)
  4. Posts on this outbreak do not occur daily - I presume, as for avian influenza virus outbreaks etc, posting of numbers is based on when those data are collated, summarized and provided to the WHO.
  5. There are reports of 4 haemorrhagic fever cases from Mali (some of whom had traveled to Guinea; a suspect case is also reported in Ghana coming from Mali although there are questions about where from precisely) that are not, at writing, laboratory confirmed.[5] Samples are being sent to the United States for confirmation. Why not to the Institute Pasteur in Dakar, or Guinea field labs I do not know; presumably because of pre-existing arrangements?
  6. Liberia has 1 suspected EVD case in a hunter who seems to have acquired his infection locally (no contact with know EVD cases or with Guinea). This suggests to me that the vector is actively infected in the region. Perhaps this is a migratory season (seasonal change, following food sources, breeding) for this Ebola virus's animal hosts, previously found to be fruit bats, chimpanzees, gorillas, monkeys, forest antelope and porcupines in particular, eaten as "bushmeat". I admit to knowing nothing about animal movement in the region however.
  7. While EVD is "highly contagious", close contact with an infected animal host or an infected human cases' bodily fluids (blood, organs, mucous, urine, vomit, faeces and semen for up to 7-weeks post-infection) is required to acquire an infection. Generally the virus doesn't spread across distance as well or quickly as for example, influenzavirus does. This is largely because the virus is not spread the same way:
    • Sneezing and coughing is not considered a method of EVD transmission
    • Once the patient is symptomatic, they do not move around as much; from that point, spread of the virus to new people requires those people to come to the ill person. This is why healthcare workers, especially early on in an uncharacterized outbreak, and close family members caring for an ill or deceased relative number highly in new cases of EVD. 
    • Basic levels of infection prevention and control can interrupt transmission. These include good hand hygiene, use of personal protective equipment and prevention of needle stick injuries.
  8. Airborne transmission is not considered a risk factor for acquiring EVD; this is not the movie Outbreak where the fictional "Motaba" virus mutates into an airborne ebolavirus-like pathogen. Also unlike the movies, bleeding from orifices and the skin can occur, but much more rarely than the movies lead us to believe
  9. EVD signs and symptoms start suddenly 2-21-days (8-10 more common[3]) after virus acquisition and usually include fever, headache, joint and muscle aches, weakness, diarrhoea, vomiting, stomach pain, loss of appetite and may also include rash, sore throat, red eyes, hiccups, cough, chest pain, breathing and swallowing difficulties and sometimes internal and external bleeding. Not everyone dies from infection however the higher end of the mortality spectrum for the species Zaire ebolavirus can reach 90% in outbreaks with >1 case identified.[4]
  10. A person with no signs or symptoms of disease is not considered contagious.
  11. While a border closure (Senegal) and some flight restrictions have come into play, these may only serve to disadvantage the outbreak region rather than provide any true risk mitigation. Closing a border may hinder the flow of food, medical supplies and daily goods as well as interrupting the normal commerce of the country, impacting both economically and directly on the lives of the overwhelming majority of people who are not infected. I'm not aware of any evidence that shows closing a border has any reducing effect on an Ebola outbreak. Closures are a knee-jerk reaction caused by the fear of a scary disease.
And that last point is an important one. Ebola evokes some scary images outside of Africa. And so it's important for us not to run around like a decapitated Gallus gallus domesticus. We need to rein in the excessive over-reaction. As Maryn McKenna aptly noted recently over on Superbug, many things are killing more people, more regularly every day both in and outside of Africa. Having said that, I can totally understand the reactions of those living inside of West Africa just now. Among them, those who both have or have never looked this pathogen in its filovirusy-eye and stared down the barrel of its disease before. 

Viruses can be pretty scary things indeed.

References..
  1. WHO Global Alert and Response (GAR) Disease Outbreak News (DONs) Articles
    http://www.who.int/csr/don/en/
  2. WHO African Regional Office (WHO-AFRO)
    http://www.afro.who.int/en/media-centre/pressreleases.html
  3. Signs and symptoms of EVD or Ebola haemorrhagic fever (HF) from US Centers for Disease Control and Prevention
    http://www.cdc.gov/vhf/ebola/symptoms/index.html
  4. WHO EVD fact sheet
    http://www.who.int/mediacentre/factsheets/fs103/en/
  5. WHO AFRO EVD West Africa SitRep for 4-April-2014
    http://www.afro.who.int/en/clusters-a-programmes/dpc/epidemic-a-pandemic-alert-and-response/outbreak-news/4079-ebola-virus-disease-west-africa-5-april-2014.html
  6. A Patient in Minnesota Has Lassa Haemorrhagic Fever. (Don’t Panic.)
    http://www.wired.com/2014/04/minnesota-lassa/

Thursday, April 3, 2014

Can we believe every H7N9 seroprevalence study we see?

Special Guest writer: @influenza_bio

A little over a year ago, the first known human patient got sick with avian influenza virus(H7N9). The number of H7N9 cases rose and fell in the spring of 2013, and a total of 134 people were known to have contracted H7N9 before June, 2013. Since then, sporadic cases appeared in the summer and fall, and by the end of December, 2013, new cases started to pick up again. We have now seen a second wave rise and fall, although several new cases still being reported each week. As of the time of this writing, just over 400 people are known to have been infected with H7N9. The case fatality rate (CFR) – roughly speaking, the percentage of people infected with H7N9 who die from it – for these known cases is almost 40%.

One question that is on a lot of people's minds is, how many other H7N9 cases are out there that we don't know about? How many mild cases are there that never get tested? How many asymptomatic cases are there that are missed? If there were a lot of undetected cases out there, that would mean that H7N9 is a lot less fatal than the known cases would make us think. On the other hand, if we were somehow miraculously seeing every single actual case, then the CFR would be as bad as all of these cases make it out to be. (And imagine what the CFR would be like without hospitals, ventilators and oseltamivir!)

How do we find out if there are cases that we're missing? One way is to do what is called a seroprevalence study. This means collecting blood samples from as wide a swath of a population as possible and testing to see how many of these samples have antibodies to H7N9. Antibodies are molecules that are made by cells of the immune system and that stick to specific pathogens to help our bodies to rid themselves of these pathogens. If someone gets sick with H7N9 influenza, his or her body would most likely continue to produce a significant amount of antibodies specifically against that strain for at least a good number of months after infection and possibly much longer. In general, people who are infected with influenza but who do not develop symptoms will also produce such antibodies, but their bodies will make fewer of them, and, on average, they won't make as many of them for as long. We don't know exactly what the pattern of antibody production is for people who are infected with H7N9 but don't develop symptoms, though, because researchers haven't identified enough of these individuals to study.

It is very important that we get these seroprevalence studies right. If they're done wrong and we miss a lot of cases, then we will simultaneously underestimate how common H7N9 cases are and overestimate how deadly the strain is. On the other hand, if seroprevalence studies are done wrong and we think a lot of people were infected with H7N9 when they weren't, then we will overestimate how common H7N9 cases are but underestimate how deadly the strain is. Facts can help us to respond to H7N9, and if we get the facts wrong, then we can't respond properly. For example, if we come to think mild H7N9 cases are far more numerous than the severe ones that actually get diagnosed, then we might not worry as much about H7N9 as we should.

What I'd like to talk about here are some of the important ways that seroprevalence studies can go wrong. To answer my title question, no, we cannot always believe the conclusions of every seroprevalence study we see. Scientists make mistakes, just like everyone else, and sometimes things just go wrong, too. I'd like for you to understand just how some of these mistakes can arise, so that you can better judge for yourself whether a study is likely to be reliable or not, or so that you can at least know that there are things out there that can go wrong.

How are seroprevalence studies done?

There are 2 types of laboratory assays (tests) that are usually used in seroprevalence studies (although there are others): hemagglutination inhibition (HI) assays1and microneutralization (MN) assays.2 (For more information about the HI assay in general, see a nice description by Dr. Racaniello.3) MN assays are considered better (more sensitive and specific) than HI assays, but they are harder to do. MN assays require a significant amount of extra work at the end that HI assays don't. But, more importantly for H7N9 studies, HI assays can be done with either "killed," modified or "live" virus, whereas MN assays require "live" H7N9 virus. In other words, HI assays can be done in almost any lab, but MN assays require a BSL-3 lab. A neutralization assay4 has been developed that uses a "pseudovirus" instead of live H7N9 and is therefore far less hazardous to work with, but formal WHO diagnostic criteria still require standard HI and/or MN assays.

First, blood samples are collected. Each blood sample is drawn into a tube, and after 15-30 minutes, the tube is centrifuged to separate clotted red blood cells from the rest of the blood. The red blood cells are discarded; what's left is called serum, and that's what's studied. The serum samples should then be put in a refrigerator if they'll be studied within a few days; if they'll be studied later, they should be frozen. Once a researcher is ready to study the serum samples, the serum samples are thawed. Virus is also used for the assay, so one or more tubes of virus are thawed, too. Different types of mammalian or bird cells are prepared: typically horse, turkey or chicken red blood cells for HI assays, or a special type of dog kidney cells ("MDCK" cells) for MN assays. Various solutions are prepared. Serum samples, virus preparations and cells are diluted as needed, and everything is transferred into little wells in a plastic "plate" in just the right way. In the HI assay, the plate then sits at room temperature for 1 hour, after which it is "read" by eye. In the MN assay, the plate then sits at 37°C (body temperature) for 19-21 hours, after which it is read by a machine (an "ELISA reader"). The assay is done. The results of the assay are then written down and analyzed, and voilà, a paper appears in the scientific literature.

What could possibly go wrong with these blood tests?


Let's start with some things that can go wrong with the lab work:
  1. If blood samples are left sitting around for a long time without being centrifuged, the red blood cells will start to break apart, and enzymes released from the red blood cells will start to destroy antibodies (and everything else) in the blood samples. This happens even faster if blood samples are not refrigerated.
  2. If serum samples are left in the fridge too long, things can start to deteriorate, just like food in your fridge would. The antibodies that you would like to measure start to be broken down. (Sometimes, for many different kinds of studies, people study serum samples left over after patients' blood tests at hospitals. Those samples sometimes sit around in a fridge for quite a while. Some of them can even be green from stuff growing in them while they're sitting around. Yuck.)
  3. If plasma (what's left in blood after unclotted red blood cells are removed) is used instead of serum (what's left in blood after clotted red blood cells are removed), then the assay can read artificially high. Serum should always be used, not plasma.
  4. Every time serum is frozen and thawed, some of the antibodies are effectively destroyed. This should not be done over and over. Serum samples should be put into the right size tubes that the researcher will want to use, so that the samples are put through only 1-2 "freeze-thaw cycles" before they are tested. And all serum samples should go through the same number of freeze-thaw cycles.
  5. The same thing is true for virus samples used in MN assays. A single freeze-thaw cycle can reduce virus infectivity by a factor of 10. Virus samples also need to be kept on ice when they're being worked with.
  6. The plate can be read wrong. It's hard to imagine reading an HI assay plate wrong, but a special procedure (ELISA) and special equipment (ELISA plate reader) are used in the MN assay, and ELISA assays can go wrong.
But, hopefully all of that was done right. Not all researchers, students and technicians are created equal, but hopefully the lab "PI" (Principal Investigator; the person running the lab) is competent and ensures that everyone is doing things correctly.

What could go wrong with the data analysis?

What else could go wrong? The data analysis might not be done correctly. And it's here where perfectly good data can be ruined and where you have to look at seroprevalence studies most closely.

Suppose you've measured your antibody amounts ("titers") in your serum samples. How do you decide which titers mean the sample came from someone who was infected with H7N9, and which titers mean they didn't? Do you just pick a number out of thin air? If you don't have data to tell you which titers mean what, then all you are doing is measuring antibody levels in a population, and you can make no interpretation about what those levels mean. You can't say that they mean any people have or have not been infected with H7N9 at all.

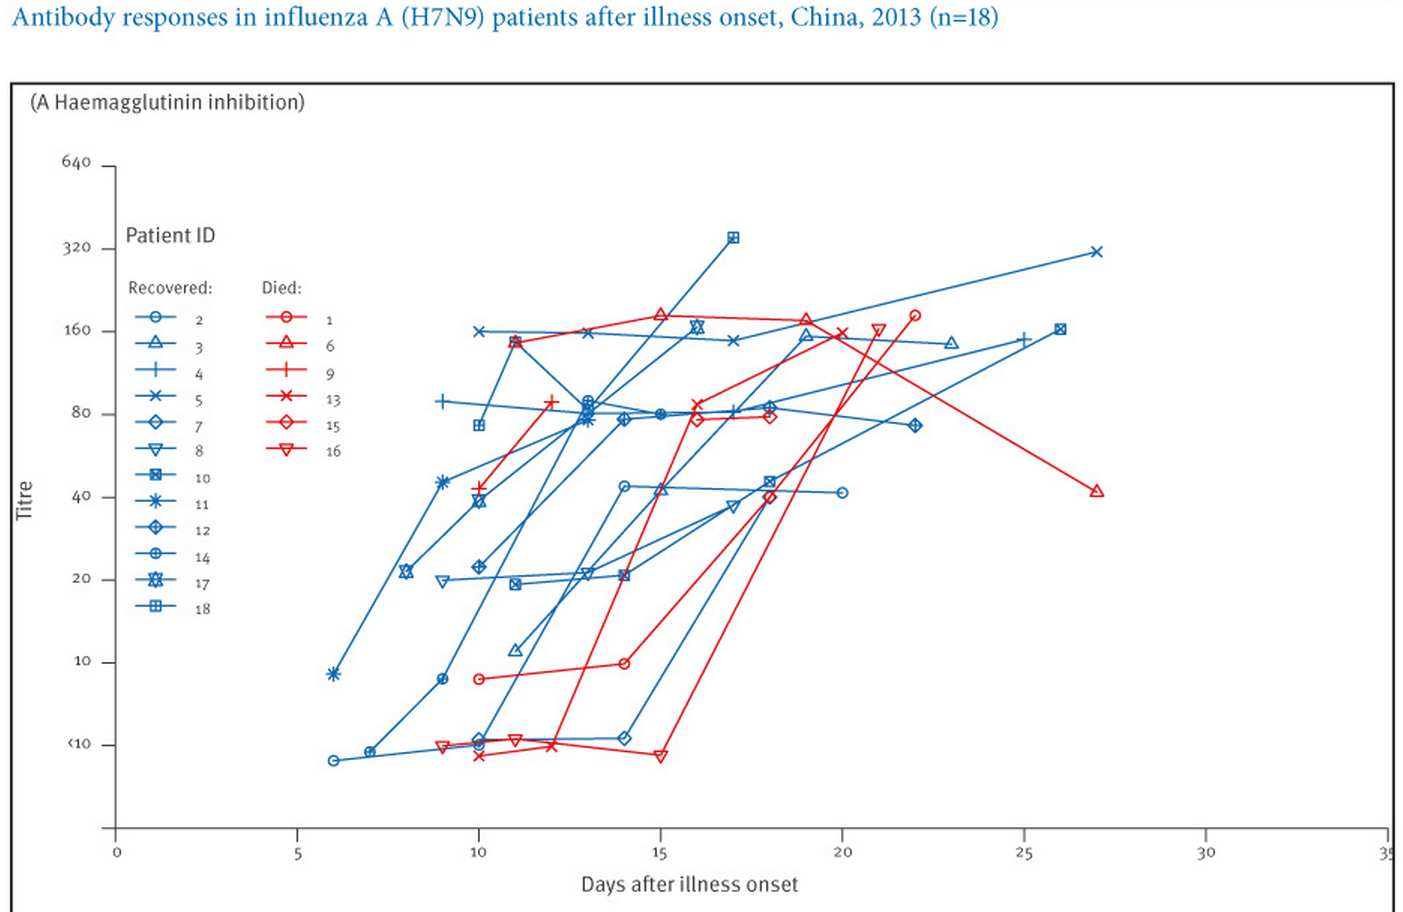
Instead, you need actual measurements using serum samples from people who are known to have been infected with H7N9 to tell you what your titers mean. Someone has to study a number of patients to see what their actual H7N9 antibody titers are, and then a mathematical analysis of that data is done to come up with a threshold titer value, above which serum samples can be said to have come from people infected with H7N9 with some large degree of certainty, and below which they are thought to have come from people who were not infected. We've seen almost no asymptomatic cases (cases with no symptoms), so we really can't say much about them. So we have to go with data from H7N9 patients who have had symptoms. Here's a great graph showing antibody titers, as measured using the HI assay, in serum samples from H7N9 patients:5

Figure 1. H7N9 HI
Euro Surveill. 2013 Dec 12;18(50):20657

As you can see in the graph above (Figure 1), by around 3 weeks after infection onset, all samples from patients whose HI titer was measured had titers 40.

The graph below (Figure 2), from a different study,4 shows that the HI titer for all H7N9 samples studied by this set of authors was also 40. In addition, this graph shows titers from "control" samples (i.e., samples from people who did not have H7N9 infections); all control samples had titers that were <40.

Figure 2: H7N9 IC50 HI4
Emerg Infect Dis. 2013 Oct;19(10):1685-7

Finally, below (Figure 3) is another nice graph, from a third study,6 showing anti-H7N9 antibody levels ("IgG"), "HI" assay results and MN assay ("NAb") results for several H7N9 patients, again showing that all samples from the H7N9 patients studied had HI titers 40. This graph also shows that all H7N9 patient serum samples had an MN titer of 20, if samples were taken after enough time had elapsed since their infections had started.

Figure 3. H7N9 IgG HI NAb.
Emerg Infect Dis. 2014 Feb;20(2):192-200

In other words, if an individual's anti-H7N9 antibody titer is 40 by the HI assay or 20 by the MN assay, these data suggest that we could pretty safely say that he or she has had a symptomatic H7N9 infection within the past few months, and if the HI or MN titers are below those cutoffs, then the individual probably hasn't had a symptomatic H7N9 infection. We don't know to what extent asymptomatic H7N9 infections will be captured by these cutoffs, but it is likely that some asymptomatic cases would be missed using these cutoffs. It is also possible that some mild infections could be missed using these cutoffs. However, it would be a great step forward just to get estimates of what percentages of any regional population or occupational group of people have had any kind of H7N9 infection. A comparison of antibody titers for asymptomatically infected and symptomatically infected H5N1 cases may be instructive when thinking about H7N9.7

WHO guidelines are even stricter than the cutoffs discussed in the paragraph above. WHO guidelines say that, using the HI assay, only single samples with titers of 160 can be considered "seropositive": "Paired sera (acute and convalescent sera) with a 4-fold rise in HI titer or single sera collected in convalescent phase with HI titer of ≥160 could be considered as H7N9 HI antibody positive. Sera with HI titer of 20-80 should be confirmed by MN or WB assay."1 For the MN assay, however, the WHO does not give specific cutoffs: "With single-serum samples, care must be taken in interpreting low titers such as 20 and 40. Generally, knowledge of the antibody titers in an age-matched control population is needed to determine the minimum titer that is indicative of a specific antibody response to the virus used in the assay."2

Now, it should be noted that WHO assay instructions recommend the use of horse red blood cells for the HI assay, and not everyone uses horse red blood cells. Some people use chicken, turkey, guinea pig or other kinds of red blood cells. That starts making comparisons between different groups' assays difficult. Horse red blood cells are better to use than turkey red blood cells for H7N9 because they have more a2,3-linked ("bird") sialic acids (influenza receptors); HI results are more sensitive with horse red blood cells. In other words, it may take less antibody in the assays to get the same result using horse red blood cells than it would using turkey red blood cells. This would translate into a higher number, when discussing H7N9 patient titers, for HI assays using horse red blood cells, compared to assays using turkey red blood cells. I have not seen direct comparisons of titers obtained using different types of red blood cells in HI assays specifically for H7N9, but the situation is probably similar to that for H5N1.8

Figures 1 and 3 above were made with HI data obtained using horse red blood cells. Figure 2 used guinea pig red blood cells. Are they completely comparable? No. Are they pretty comparable? Yes.

Are you getting a feeling for how complicated it is to interpret a seroprevalence paper? And for how difficult it is to compare results across studies?

Why does all of this matter?

It matters because some seroprevalence studies don't use appropriate cutoffs. And because it can be hard to determine even what an appropriate cutoff is when red blood cells from different species are used in an HI assay. This is where the reader has to be really careful. Cutoffs for seropositivity have been a big issue9 with H5N1 seroprevalence studies; some researchers have used cutoffs that were too low, and hence they have almost certainly overestimated how common H5N1-specific antibodies were in the populations studied.

So far, only one H7N9 serology paper published to date has reported probable seropositive samples, and this paper simply reported HI titers without using any specific threshold for seropositivity. Only one used study horse red blood cells in HI assays. The one paper that used an MN assay did use appropriate cutoffs. It should be noted that the new WHO HI guidelines were only published in December, 2013, after a couple of these papers were already published.

Here are the studies that have been published so far (I hope I haven't left any out):

  1. Bai et al.10 looked at serum samples collected before November, 2012 from poultry workers in eastern China and found no H7N9-positive samples. The study used HI and MN assays. Turkey red blood cells were used in the HI assay. Appropriate cutoffs were used for the MN assay.
  2. Hsieh et al.11 studied 14 close contacts of the first H7N9 case in Taiwan. The authors took blood samples within 18-28 days after the contacts' earliest exposures. The authors used an HI assay but not an MN assay. They used turkey red blood cells for the HI assay. They found all contacts to have an HI titer £10, and declared all to be seronegative. The HI titer for the H7N9 patient in their study was 1:80. These conclusions seem very sound.
  3. Yang et al.12 looked at serum samples from 1129 people from regions of China in which H7N9 cases had been seen, and from 396 poultry workers from 10 districts in which H7N9 cases had been seen. None of the samples from the general population was found to be seropositive, whereas >6% of the poultry workers were found to be seropositive. The authors also examined serum samples from several H7N9 patients. The study used an HI assay but not an MN assay. The authors used a cutoff of 80, along with turkey red blood cells, for the HI assay. Because the authors examined serum samples from H7N9 patients using their methods and got results that are reasonably similar to other results, their cutoffs are most likely reasonable, and their conclusions are probably quite sound. The authors report:
    • "Of the 1129 serum samples collected from individuals (age range, 1–88 years) in the general population, 9 (0.8%) had an HI titer of≥40 to influenza A(H7N9), but no serum samples with an HI titer of≥80 were found (Table 1). In contrast, among poultry workers, 13.9% (55/396) and 6.3% (25/396) had influenza A(H7N9) antibody titers of ≥40 and ≥80 (20 had an HI titer of 80, and 5 had an HI titer of 160), respectively."

      It is hard to imagine that an HI titer of 160 can be a spurious finding ("non-specific," to the initiated). Thus, these data strongly suggest that at least some H7N9 cases have been going undetected among poultry workers. Suppose we consider only the poultry workers with HI titer ≥80, or 6.3% of the poultry workers. If we then consider how many poultry workers there are, total, in districts from which H7N9 cases have emerged, then this study suggests that it's possible that quite a large number of poultry workers have been exposed to H7N9. Still, this study examined only a very small number of people, and we should be cautious about reading too much into these results.
  4. Qiu et al.13 looked at 3 H7N9 patients and 3 close household contacts of the patients who were exposed before infection control practices were put in place. The authors looked for viral RNA using a sensitive test (PCR) and examined serum samples drawn 15-26 days post-exposure using both an HI assay and a pseudovirus-based neutralization assay. They found no contacts to be seropositive. The H7N9 patients had HI titers that reached 160-640 during this time, and the patient contacts all had titers <10. The authors used horse red blood cells for the HI assay. These findings also seem sound.
To summarize, the conclusions from all of these papers do seem sound. But, it would be wise to keep all of these issues in mind as subsequent studies appear over time.

An additional study14looked at antibody titers in 1723 serum samples collected in Vietnam using a very different kind of assay (a protein microarray). Because seropositivity cutoff levels had not been determined with authors' assay methods using actual H7N9 patient samples, these authors were appropriately very careful not to attempt to draw any conclusions about H7N9 seroprevalence from their data:

"Because titers calculated from our assay are not directly comparable to HI or microneutralization tests, no cutoff is chosen to represent positivity or clinical protection. It is not possible to associate these titers with past exposure or past infection, as serological assays have not yet been validated for H7N9."

For the future

So, as new H7N9 serology studies gradually come out, you be the judge. Figure out whether they're believable or not. Ask yourself the following:
  1. What assay(s) were used? Did the authors use an MN assay? They get bonus points if they did. 
    • If only an HI assay was used, then the conclusions are slightly less certain than if an MN assay was used.
  2. If the authors used an HI assay, what species were the red blood cells from?
    • If horse red blood cells weren't used, then HI titer cutoffs lower than 160 are probably appropriate, but there is also more uncertainty about what an appropriate cutoff would be.
  3. What cutoff(s) did they use for seropositivity in their assay(s)? Do these cutoffs mesh with WHO guidelines? Do they mesh with what we know about H7N9 patient HI and MN antibody titers?
References
  1. http://www.who.int/influenza/gisrs_laboratory/cnic_serological_diagnosis_hai_a_h7n9_20131220.pdf
  2. http://www.who.int/influenza/gisrs_laboratory/cnic_serological_diagnosis_microneutralization_a_h7n9.pdf
  3. http://www.virology.ws/2009/05/27/influenza-hemagglutination-inhibition-assay/
  4. Qiu C, Huang Y, Zhang A, Tian D, Wan Y, Zhang X, Zhang W, Zhang Z, Yuan Z, Hu Y, Zhang X, Xu J. Safe pseudovirus-based assay for neutralization antibodies against influenza A(H7N9) virus. Emerg Infect Dis. 2013 Oct;19(10):1685-7
  5. Zhang A, Huang Y, Tian D, Lau EH, Wan Y, Liu X, Dong Y, Song Z, Zhang X, Zhang J, Bao M, Zhou M, Yuan S, Sun J, Zhu Z, Hu Y, Chen L, Leung CY, Wu JT, Zhang Z, Zhang X, Peiris JS, Xu J. Kinetics of serological responses in influenza A(H7N9)-infected patients correlate with clinical outcome in China, 2013. Euro Surveill. 2013 Dec 12;18(50):20657 
  6. Guo L, Zhang X, Ren L, Yu X, Chen L, Zhou H, Gao X, Teng Z, Li J, Hu J, Wu C, Xiao X, Zhu Y, Wang Q, Pang X, Jin Q, Wu F, Wang J. Human antibody responses to avian influenza A(H7N9) virus, 2013. Emerg Infect Dis. 2014 Feb;20(2):192-200
  7. Buchy P et al., PLoS One. 2010 May 27;5(5):e10864
  8. See, e.g., Table 4 in Pawar SD et al., Virol J. 2012 Oct 30;9:251
  9. Osterholm MT and Kelley NS, MBio. 2012 Feb 24;3(2):e00045-12
  10. Bai T et al., N Engl J Med. 2013 Jun 13;368(24):2339-40
  11. Hsieh SM et al., J Infect. 2013 Nov;67(5):494-5
  12. Yang S et al., J Infect Dis. 2014 Jan 15;209(2):265-9
  13. Qiu C et al., J Clin Virol. 2014 Feb;59(2):129-31
  14. Boni MF et al., J Infect Dis. 2013 Aug 15;208(4):554-8

NOTE: I did not have a hand in writing this post and thus take no credit for it. This was entirely the work of the Guest Writer.