Showing posts with label epidemiology. Show all posts

Friday, September 26, 2014

MERS-CoV data request: A response from the Ministry of Health

Four days after I posted a blog requesting missing data on retrospective Middle East respiratory syndrome coronavirus (MERS-CoV) detections and deaths, I received a response. 

Dr Anees Sindi, Deputy Commander of the Command and Control Centrer, Ministry of Health, Saudi Arabia replied. With his permission, I have reproduced his reply below.
______________

Sent: Tuesday, 23 September 2014 6:36 PM
To: Ian M Mackay
Subject: Re: your request for missing data on retrospective MERS-CoV detections

Dear Dr. Mackay,

I’m writing in response to your blog posting entitled “A request for missing data on retrospective MERS-CoV detections.”

Thank you for acknowledging the steps that the Ministry of Health’s Command & Control Center has taken to ensure members of the public -- including researchers around the world -- have access to real-time information about MERS-CoV cases in the Kingdom of Saudi Arabia.

These daily postings are a small step on our journey toward full transparency. We want scientists to have access to the data they need to produce meaningful publications that advance our understanding of this disease for the benefit of mankind.

With that in mind, I am happy to inform you that the Ministry of Health is in the process of preparing additional data for public release. I will follow up with you once we have a confirmed release date.

Collaboration with the international research community is a key pillar of our work. In addition to sponsoring more than 30 research projects focused on MERS-CoV, the Ministry of Health has opened its doors to academics and experts from the World Health Organization and U.S. Centers for Disease Control & Prevention. MOH shares more data with the WHO than is required under the International Health Regulations, and we stand ready to support other scientists with an interest in better understanding coronavirus.

Thank you again for your interest in our work.


Best Regards,

Dr. Anees A. Sindi
Deputy Commander
Command and Control Center, Ministry of Health
Saudi Arabia


______________

This is fantastic news and I am very excited to hear that we may soon be able to complete the data picture for MERS-CoV. 

I am most grateful to Dr Sindi, the Minister and the Ministry for taking my request seriously and for replying to it so quickly.


With these data in hand, many of us will be able to build better epidemiological picture of the timing, spread and impact of MERS-CoV over the past 2 years as well as more specifically quantify MERS among fatal cases. 

These data do not answer all the questions we have of course, but they definitely answer some, and for that I'm thankful.

This social media thing does seem to have some impact.

Thursday, July 31, 2014

Virus variability, dopey data and insufficient infection control do not support the theory that bioterrorism is behind the ongoing MERS-CoV outbreak.

A collaborative note from (alphabetically): @influenza_bio, @MackayIM, @maiamajumder, @neva925, @stgoldst, @kat_arden

In an unusual twist to the ever-entertaining Middle East respiratory syndrome coronavirus (MERS-CoV) narrative, a new study has been published(1,2) that calls upon us to consider seriously, or at least acknowledge, the possibility that bioterrorism explains the emergence of this virus as a rare but often deadly human pathogen. Dr Raina MacIntyre (@RainaMacIntyre) of the University of New South Wales suggests that "deliberate release" may explain the allegedly paradoxical pattern of ongoing MERS-CoV infections in Saudi Arabia. She concluded this after comparing MERS-CoV numbers to the 2003 epidemic of severe acute respiratory syndrome coronavirus (SARS-CoV).(3) Apparently, the elephant in the room that we may all be overlooking is the possibility that the virus is being or has been released deliberately in repeated acts of bioterrorism.

“Bioterrorism” is inherently an evocative and emotive word; it has the ability to elicit the sort of worry and fear among the wider community generated by the likes of “Ebola” and “deadly airborne virus”. It also feeds conspiracy theories.

In our collective opinion, bioterrorism, with respect to MERS-CoV and otherwise, should not be invoked without at least some preliminary data that point specifically to a deliberate human cause. 

We would like to make it clear that we don't object to considering bioterrorism as a potential cause of the emergence of MERS-CoV. It is always worth considering whether an outbreak of any human, animal or plant disease is due to deliberate human activity. Thankfully, there are people whose jobs are to do just that. 

However, we have some concerns about the rationale put forth in Dr. MacIntyre's paper regarding why bioterrorism may explain sporadic MERS-CoV infections better than nature and would like to highlight some notable factual errors and omissions that might have influenced her conclusions. No data are available that could decisively rule out the possibility of bioterrorism as the cause of the ongoing MERS-CoV outbreak, as one cannot prove a negative. Nonetheless, we believe that Dr. MacIntyre's arguments are flawed and that the available evidence cannot be used to support her theory. Substantial scientific and methodological problems exist in Dr MacIntyre’s paper that undermine her deliberate release theory. Here, we discuss some of these issues, and we offer perspective on why bioterrorism is unlikely to be a cause of human or animal MERS-CoV infections.

MERS is different to SARS. Yep. We already knew that.

A substantial amount of Dr MacIntyre’s report is based on comparing MERS to SARS.(4) MERS-CoV and SARS-CoV are genetically, taxonomically and phylogenetically divergent, and MERS and SARS are immunobiologically, clinically and pathologically distinct. Furthermore, their transmissibility in humans, their environmental contexts, their animal hosts and the interactions between their animal hosts and humans are different. Thus, the comparison between the two viruses must, a priori, result in finding MERS and SARS outbreaks to be characteristically different. That SARS and MERS are different has also been stated previously.(5,6) Compared to SARS, MERS generally progresses more rapidly and occurs more frequently in individuals with pre-existing medical conditions, including diabetes, chronic lung disease, renal failure and in people who are immunocompromised. Moreover, MERS-CoV exhibits a broader tissue tropism and induces faster cellular damage than SARS-CoV; it also employs a completely different receptor and prompts a comparatively delayed cellular immune response. These two viruses belong to separate lineages within the genus Betacoronavirus; they are chalk and cheese.

Moreover, from an epidemiological viewpoint, it is extremely important to note that human cases of infection with these two viruses have never geographically overlapped. This is no small fact. The population of Saudi Arabia seems to have an unusually high proportion of older males (Fig 1) with pre-existing medical conditions; from the data that are currently available, this particular group also appears to be most vulnerable to fatal outcomes. Outside this population, MERS-CoV infections seem to be far less frequently associated with severe disease and death.
 
Figure 1. Older males represent a greater proportion of MERS cases and even more of the deaths attributed to infection with MERS-CoV.

Perhaps most salient to this discussion is that MERS-CoV does not transmit in humans as well as SARS-CoV did. In fact, MERS-CoV transmits quite poorly between humans unless a perfect storm of pre-existing medical conditions and poor infection prevention and control in a healthcare setting, and perhaps the right environmental factors, occur. 
Dr. MacIntyre compared epidemic curves for SARS and MERS to show that, aside from this year’s March/April hospital outbreaks, the appearance of new MERS cases doesn't follow the same pattern that new SARS cases did. Namely, new MERS cases have continued to appear at a trickle, up until a few weeks ago, whereas SARS disappeared entirely once human-to-human transmission was stopped. One explanation for this is that the Arabian Peninsula has a lot more domesticated camels, which are believed to be the primary host reservoir for MERS-C0V, than China has captive civet cats, which serve as an intermediate host transmitting SARS-CoV from bats to humans. For this and other reasons, there may be a far greater number of opportunities for repeated zoonotic transmission of MERS-CoV than there was for SARS-CoV. In support of this idea, it has been found that those who work with camels are at greater risk of acquiring MERS-CoV than are those who do not.(7) 

In short, MERS-CoV is barely contagious among humans but highly zoonotic, and SARS is highly contagious among humans but barely zoonotic.

All of these considerations are reasons to dissuade one from expecting much overlap between the epidemiology of SARS and that of MERS.   

Dr. MacIntyre's arguments that some features of the MERS outbreak may be specific to the repeated, deliberate release of MERS-CoV are not supported by evidence.

Dr. MacIntyre states that the ongoing MERS outbreak appears to involve "sporadic ongoing infections from a non-human source." We agree, with the caveat that such infections represent a minority of cases; most cases have resulted from short human-to-human transmission chains in healthcare settings.8 Dr. MacIntyre further states that, "Possible sources of ongoing sporadic infection in humans include animals (camels appear the most likely source), or deliberate release." However, she argues that the epidemiological data may be more easily explained by deliberate release than by infections acquired from animal (camel) sources.

The main features of MERS-CoV infections that are suggested in Table 1 of Dr. MacIntyre's paper to distinguish between deliberate and natural infections are the following:

   In support of deliberate release, but not natural infections:
  1. "Evidence of multiple introductions in a single outbreak."
  2. Possibly, "Several cases with no link to human OR zoonotic source."
  3. Possibly, "Multiple genetic strains in a single hospital outbreak at Al Ahsa Hospital."
   In support of natural infections, but not deliberate release:
  1. "MERS-CoV identified in camels."
Below, we respond to each of the features of the ongoing MERS-CoV outbreak that Dr. MacIntyre has suggested provide evidence in favor of deliberate release.

  1. MERS is repeatedly introduced into the human population, most likely because humans are repeatedly exposed to animal sources of the virus.
    While we have yet to see seroprevalence data (though we have on good authority that community seroprevalence is low and a detailed report on the matter will be released soon), no evidence of high population prevalence exists. So far, cases have been sporadic without prolonged chains of human-to-human transmission. Healthcare settings, especially hospitals, have served as both amplifier and nexus for human-to-human spread; approximately 75% of the surge of cases in Saudi Arabia during March-May 2014 are thought to have resulted from human-to-human transmission, primarily in these settings.(9) In fact, many cases initially thought to have been primary, zoonotic cases have subsequently been linked to exposures to confirmed human cases.(8) Also, more than 25% of all cases have been healthcare workers, highlighting the extent of nosocomial (hospital-related) transmission.(8) Moreover, despite Dr MacIntyre’s assertions, a substantial proportion of cases have been mild. Between a quarter (of detections worldwide) and a third (of 113 previously unreported cases announced by the KSA Ministry of Health in early June 2014) were asymptomatic, i.e., they had no notable signs or symptoms of illness.

    However, until a pause this July, new MERS cases have been detected almost continuously at low levels over the past year or more. Aside from outbreaks in healthcare settings, these cases are thought to be by and large primary, zoonotic cases, i.e., caught from an animal source, most likely related to camels. Thus, we agree with Dr. MacIntyre that many MERS cases are likely due to multiple introductions into humans; however, we disagree with the idea that this points more to bioterrorism than to an animal source. Instead, we believe that multiple introductions into humans more likely reflect ongoing exposures to infected animals or contaminated animal products; a lot of camels live in and are also imported into the Arabian Peninsula. It is important to note that multiple introductions into humans have also been observed with other zoonotic pathogens as well, including highly pathogenic avian influenza A (H5N1) virus(10) and avian influenza A (H7N9) virus.(11) Existing health conditions have an impact on disease outcomes in such other zoonotic diseases, too. Repeated introductions of a virus into a human population are not unique to bioterrorism; nature does a very good job of creating confounding epidemiological conundrums that are often made worse by inadequate human responses.
  2. We don't know of a source of exposure for a proportion of MERS cases, but that's probably just because we don't have perfect information.
    Small numbers of sporadic cases have been reported for which no contact with other confirmed cases or animals is known. Dr. MacIntyre suggests that the simplest explanation for these cases may be bioterrorism. In our opinion, however, these cases may be explained most simply by the pervasiveness of incomplete case histories, and occasionally by contact with undiagnosed cases, rather than by the deliberate release, past or ongoing, of pathogens into the environment. Moreover, patients or their relatives may not be aware of all relevant interactions with animals or animal products, and we also may not be asking the right questions about those interactions. We will simply never know about all relevant contacts for every infected person; we never really do for any viral outbreak. MERS is a fairly new disease, and even the experts are unclear about how MERS-CoV is transmitted from camels to humans or even from humans to humans, for that matter. Let's figure out the basics before we say that bioterrorism is a more likely cause than nature.
  3. Genetic variability among different human MERS-CoV variants is small and probably results from natural variability in MERS-CoV; viruses are naturally diverse.
    The fact that multiple MERS-CoV strains were detected in a single outbreak at Al-Ahsa Hospital suggests only that the outbreak resulted from human-to-human transmission of virus introduced via multiple zoonotic events that exhibited some expected genetic variability. Such multiple introductions have been documented and explained already.(12) While it’s possible (though unlikely) that several viral variants were deliberately released, nature is quite capable of doing this without human help.

    Genetic variation among MERS-CoV isolates has indeed been detected in Saudi Arabia. However, the changes have affected <2% of the entire genome, a degree of variation that is not uncommon within other endemic human coronaviruses. Virus variation can also occur among MERS-CoV strains passaged through cells in culture, indicating that virus-driven adaptive changes are not unusual in this virus under a variety of host and growth conditions. Furthermore, the genotypes found in both camels and humans throughout the Arabian Peninsula have generally been no more or less divergent than what we’ve seen in Saudi Arabia thus far. The exception is a strain found in a camel in Egypt that had been imported from Sudan or Ethiopia;(13) this strain is notably more divergent and may hint at an as yet untapped source of variation to be found in geographically dispersed cousins of the Saudi viruses.  Genetic variability occurs naturally among viruses, including zoonotic viruses,(14) and is not a hallmark of bioterrorism.
There are better ways to explain the unusual features of the observed epidemiology of MERS-CoV.

Dr. MacIntyre states, "The continued increase in cases in KSA in 2014, without satellite epidemics in other countries, and without consistent animal contact in all cases is inexplicable." These observations are not inexplicable for a virus that transmits poorly. We argue that satellite epidemics have not been observed simply because secondary, human-to-human spread of MERS-CoV is rare and is, moreover, most likely attributable to a small percentage of cases. We have seen evidence for such inefficient transmission in almost every exported MERS case to date. People sitting next to a confirmed case during tours and on planes have not become ill; nor have they tested positive for MERS-CoV. Apart from weaknesses in the virus and environmental factors (e.g. temperature, humidity, outside camel birthing season), good infection prevention and control may also play a role in limiting spread. 

Dr MacIntyre suggests, further, that, “If the large recent increase in cases in KSA is due largely to person-to-person transmission, other similar increases (satellite epidemics) would be expected in other countries.” However, even though satellite epidemics have not occurred, it is a fact that most cases in the spring in the KSA were due to human-to-human transmission. The healthcare-related outbreak in Jeddah was tied to location-specific failures of infection prevention and control, as the World Health Organization (WHO) has pointed out.(8,15)

As for cases "without consistent animal contact," we hope that Dr. MacIntyre is not expecting proof of animal contact for every case, but rather for suspected primary cases only. As discussed above, most cases have reportedly resulted from human-to-human transmission, and the rest are probably accounted for by incomplete medical case histories and overlooked contacts with an undiagnosed case or infected camel source. Alas, for some primary cases, we simply do not have enough information yet.

The epidemiological data used by Dr MacIntyre, courtesy of the Saudi Arabian Ministry of Health and the WHO, are imperfect. Those of us maintaining MERS-CoV detection line listings are painfully aware of the limitations associated with these data and their communication. Reporting formats have changed repeatedly, resulting in inconsistent case histories. Testing delays, reporting gaps, incomplete case information and translation errors are but a handful of issues that must be considered and controlled for when using these data to improve our understanding of MERS epidemiology.

Yes, there have been seemingly incongruous pauses in case announcements during periods of mass gatherings – times when we might expect detections of a respiratory virus to be on the rise. Yes, it appears, from the data alone, that only a handful of cases have reported animal contact, despite the fact that about 25% of human cases have been zoonotic, according to the WHO.(9) Yes, countries with cases outside Saudi Arabia more often report contact with camels. However, these “paradoxes and inconsistencies” are far more likely due to incomplete and inconsistent data collection and reporting than to a “deliberate release” of MERS-CoV as a putative category C bioterrorism agent.

How likely is it that MERS-CoV is a cultured pathogen deliberately released by bioterrorists?

The likelihood that MERS-CoV was deliberately released in Saudi Arabia is vanishingly small, and Dr MacIntyre’s article fails to provide any sound scientific basis to convince us otherwise. Each of the features of the ongoing MERS-CoV outbreak that she has put forth as an indicator of deliberate release can also occur naturally. In addition to the issues discussed above, Dr MacIntyre offered no explanation to describe a mechanism by which MERS-CoV could have been weaponized; however, given what we do know about MERS-CoV, purposeful weaponization seems highly improbable. Thus, while it is worth considering whether any disease outbreak has a deliberate human cause, Dr. MacIntyre's paper provides no evidence that supports bioterrorism as a cause of MERS. Instead, an abundance of evidence suggests that MERS results from natural causes.

MERS-CoV is known to infect dromedary camels across the Arabian Peninsula and Africa; we likely know of only a fraction of its geographic range in the latter. Moreover, the virus has been in these animals for at least 20 years. As we continue to learn, it’s looking more and more like an ancestor of MERS-CoV first emerged in bats, potentially in Africa.(16,17) If the virus did spill over from bats to camels at some point, it remains unknown when or how, as does the scope of how many other animals carry some version of MERS-CoV-like viruses. 

So, does any of this mean that a deliberately engineered form of the bat virus was purposefully released into camels more than two decades ago? Could it have been a (very poorly functioning) bioweapon intended for use against camels? Who would have created such a weapon? Or, was such a virus potentially introduced into humans first and we’ve been the source of camel infections ever since? Due to the large genome sizes of coronaviruses (the largest among all RNA viruses), reverse genetics systems, used for “made-to-order virus” construction, are quite cumbersome and demanding; only a handful of labs are known to be proficient with these systems. These significant technical requirements provide further evidence against the possibility that MERS-CoV has been used as a bioweapon.

Dr. MacIntyre states that, “when a new infectious disease emerges, bioterrorism, unless it is caused by an eradicated disease such as smallpox, may not be easily recognized for what it is unless we consider the possibility.” This, however, is not supported by the last decade of research and development, undertaken across the world, towards the goal of preventing, detecting, and mitigating the effects of bioterror. Since 2001, considerable resources have been invested in preparing for bioterrorism. This has led to the deliberate and explicit “securitization” of public health and medicine, with a focus on conceiving the potential for human-caused disease outbreaks.(18) The focus on man-made viruses and the potential for bioterror is a multibillion dollar enterprise;(19) if the status of MERS-CoV as an intentional release  agent were plausible, it would provide rare vindication for such efforts. That it has not is not for want of attention on the behalf of policymakers around the globe.

It is also worthwhile to reflect on the reasons one might release a pathogen and how the ultimate goals of any purported bioterrorist might inform their release strategy. The two iconic instances of bioterror—separate from biological warfare—in the twentieth century were the use of Salmonella enterica by the Bagwan Shree Rajneesh cult in Oregon in 1984 and the 2001 anthrax attacks.20 In both, a bacterium was used with very specific goals: the attempted manipulation of a local election and the targeting of US public service institutions. 

A poorly transmitting coronavirus, however, could not be targeted as well as the pathogens used in the above cases. It isn’t an ideal agent for more common attempts to use pathogens as weapons, either, such as the failed attempts to weaponize anthrax and the botulinum toxin by the Aum Shinrikyo doomsday cult.(20) Rather, MERS-CoV occupies a biological limbo in which its effects are too intermittent for it to be a targeted agent, but nowhere near prolific enough to be a means of generating widespread bioterror. If MERS-CoV were to be—counterfactually—a bioterror agent, then its creators would have surely failed at their task. 

We don’t see too many new diseases; there are only so many ways a pathogen can make us sick. In this sense, MERS is not really clinically distinct, and certainly nothing about MERS can be pointed out as pathognomonic; however, there still remains much to learn about the epidemiology, clinical course and virology of the disease. This is quite commonly the case, even two years after the discovery of a new viral species. By all means, investigators should consider all potential causes of outbreaks of new human pathogens, even bioterrorism. However, in the case of MERS, while detailed laboratory, epidemiological and clinical studies are absent or found wanting, the publicly available data that exist are consistent with a natural origin for the outbreak. The simplest explanations are likely still the best; in this case, when we hear hoof beats, we shout camel, not bioterrorist.

References.
  1. MacIntyre, C.R. The discrepant epidemiology of Middle East respiratory syndrome coronavirus (MERS-CoV).
    http://link.springer.com/article/10.1007/s10669-014-9506-5/fulltext.html
  2. https://storify.com/MackayIM/evoking-bioterrorism-as-a-cause-of-sporadic-mers-i/edit 
  3. http://www.who.int/ith/diseases/sars/en/ 
  4. SARS and MERS are the diseases associated with SARS-CoV and MERS-CoV infections, respectively.
  5. http://www.cdc.gov/coronavirus/mers/faq.html
  6. http://www.who.int/csr/disease/coronavirus_infections/MERS_CoV_RA_20140613.pdf?ua=1
  7. http://www.who.int/csr/disease/coronavirus_infections/MERS-CoV_summary_update_20140611.pdf?ua=1
  8. http://www.who.int/csr/disease/coronavirus_infections/MERS_CoV_RA_20140424.pdf?ua=1 
  9. http://www.reuters.com/article/2014/05/14/health-mers-meeting-idUSL6N0O03TQ20140514
  10. http://www.who.int/influenza/human_animal_interface/H5N1_cumulative_table_archives/en/
  11. http://www.who.int/influenza/human_animal_interface/influenza_h7n9/Data_Reports/en/
  12. http://www.ncbi.nlm.nih.gov/pmc/articles/PMC3898949/
  13. http://wwwnc.cdc.gov/eid/article/20/6/14-0299_article
  14. http://www.ncbi.nlm.nih.gov/pubmed/24457975
  15. http://www.ncbi.nlm.nih.gov/pubmed/23891403
  16. Corman VM, Ithete NL, Richards LR, Schoeman MC, Preiser W, Drosten C, Drexler, JF. Rooting the phylogenetic tree of MERS-CoV by characterization of a conspecific virus from an African bat. J Virol. 2014 Jul 16. http://jvi.asm.org/content/early/2014/07/10/JVI.01498-14.abstract
  17. Yang L, Wu Z, Ren X, Yang F, Zhang J, He G, et al. MERS–related betacoronavirus in Vespertilio superans bats, China [letter]. Emerg Infect Dis. 2014 July. http://wwwnc.cdc.gov/eid/article/20/7/14-0318_article
  18. Fidler, David P, and Lawrence Ogalthorpe Gostin. 2008. Biosecurity in the Global Age. Stanford University Press. 
  19. Elbe, Stefan, Anne Roemer-Mahler, and Christopher Long. 2014. “Social Science & Medicine.” Social Science & Medicine, May. Elsevier Ltd, 1–9. doi:10.1016/j.socscimed.2014.04.035.
  20. Wheelis, Mark, and Lajos Rózsa. 2009. Deadly Cultures. Harvard University Press.

Thursday, July 17, 2014

Middle East respiratory syndrome coronavirus (MERS-CoV): Age and Sex

A new static page on which I will update the MERS-CoV numbers as they relate to the age and sex of the people laboratory confirmed as infected.


Tuesday, July 15, 2014

Middle East respiratory syndrome coronavirus (MERS-CoV) by week and month...

To follow up yesterday's daily numbers chart, here we have the number of MERS-CoV detections by week (Chart 1) and by month (Chart 2). 

Not a lot of change from my last posts of these 18-June and 23-June - we are currently in our 5th straight day without any new detections being reported - and prior to this drought, there had been very few other detections for a while so we can now very clearly see the Jeddah-2014 (Kingdom of Saudi Arabia) major hospital-base outbreak peak's beginning and end.

We're also in the second half of Ramadan, putting us past the maximum likely incubation period for those visitors to the holy places that may have acquired MERS-CoV infection at the beginning go the month. A pretty good indication that MERS-CoV is not spreading among the community. It is still strange to me that a region that was yielding sporadic cases up until very recently, is now not yielding any such cases. Perhaps it's the improvements initiated under Dr Fakeih's watch, or maybe the hot, dry weather? It could be that camel contacts are reduced or that festivals are not as frequent in the extreme heat.  It would be great to see some scientific literature emerge on the Jeddah-2104 outbreak, on seroprevalence, on camel testing, gene/genome sequencing, studies of other animals or transmission investigations. Things have been very quiet on the publication front for some time now and we still know very little detail about the largest flurry of (known) cases to have occurred since 2012.

We'll wait and watch and see, I suppose.

MERS-CoV detections, worldwide (but mostly in the Kingdom of Saudi Arabia), by week.
Click on chart to enlarge.


MERS-CoV detections, worldwide (but mostly in the Kingdom of Saudi Arabia), by month.
Note the yellow star which highlights a 10-fold higher scale for 2014 y-axis (left-hand side) than in the 2013 numbers. Even 2014's puny June surpassed any month in 2013.
Click on chart to enlarge.

Monday, July 14, 2014

Middle East respiratory syndrome coronavirus (MERS-CoV) daily numbers...

Because I miss my charts, this is a quick one, made the old fashioned way (Excel and Adobe Illustrator).
MERS-CoV detections by date of illness onset (orange; when available, otherwise date of hospitalization or reporting) or by reporting date only (blue), each day since 22-March-2014. 
Click on image to enlarge.
A few things to note from this chart:

  • I've arbitrarily chosen to bracket the Jeddah-2014 outbreak as starting in the week beginning 17-March-2014 (MERS Week #106) and ending in the week beginning 19-May-2014 (MERS Week #114). There don't seem to be Jeddah-originating cases in the week after that, and case numbers are low (<5/day, similar to the same period in 2013) from then onwards...although this is not an exact science. For example, does one count those cases from the Al Qunfudah cluster that were moved to Jeddah hospitals? But it's a guide.
  • This chart has the daily case numbers (orange) based mostly on the date of illness onset. This highlights (again) the ongoing paucity of recent MERS-CoV detections which is great news for the Kingdom of Saudi Arabia (KSA). The map below previously posted here, does highlight an interesting questions. How are the small number of cases reported in June/July so widespread and where are the infections being acquired from? It's not spring (the camel calving hypothesis suggests human cases take off during the active birthing period; perhaps this is just the "ticking over", non-Spring norm for animal>>human acquisitions?) and there are no hospital outbreaks. Is this community spread? All the indicators we have point away from that. It is also a very busy time in the KSA right now with Ramadan having attracted visitors for some weeks. We have not yet seen cases appearing among those with underlying illness, an indicator or sentinel population for MERS outbreaks because they show the more obvious result of an infection. So these cases must be ongoing sporadic camel (or other animal, including goats which appeared in the recent WHO disease outbreak news) to human acquisition. Right? I'm looking forward to some widespread camel testing results from the KSA and some human seroprevalence studies would be very relevant too. Not sure what's taking so long for the latter to appear.
  • The plot of detection based on date of reporting (blue) is somewhat messed up by the found113 detections for which we have no date breakdown (see here for more detail or search VDU for found113). This means the detection all get assigned into 3-June, the date the KSA Ministry announced them. Yuck. It looks like those details are never going to materialize either. At least, my personal efforts to get date data from Prof Tariq Madani have failed, despite his public assurance that more detailed data could be made available to scientists who wanted it, and the WHO seem to have moved on to posting more contemporary cases in detail, skipping over the same level of detail for the found113.
The very good news is that Ramadan has not coughed up a plague of new MERS cases. The bad news is, we still don't really know the source of the cases that have been continuing to emerge in the KSA. Without knowing that we really don't have a handle on this disease, or this virus, at all.

Location of June/July MERS-CoV detections in the KSA.
Click on map to enlarge.

Thursday, July 10, 2014

Ebolavirus disease (EVD) cases, clusters and outbreaks mapped out...

The West African region outbreak (top map) and the totals from past Ebola outbreaks and the few imported monkey cases (the US & Philippines; hence zero human cases) plotted by total numbers and country (bottom map)

These maps are best viewed alongside my Ebola numbers page found here.


The WHO have commenced creating multi-page Situation Reports.[2] They contain more granular data than is publicly available. They will be reported at least once per week.


If I become impatient, I'll cobble together the individual country's numbers via reliefweb.int, then update that once WHO data are available (which may result in a drop in totals as WHO numbers may have been collected a littler earlier).

This is a static page - it will be updated with new numbers but the website address will remain the same.

Latest data taken from: http://apps.who.int/iris/bitstream/10665/135029/1/roadmapupdate26sept14_eng.pdf?ua=1
Date of DON: 26-Sept
Dates covered: 23-Sept


A note about the proportion of fatal cases (PFC): 
On these graphs, my PFC calculations for West African countries and the DRC are based on dividing the total number of suspect/probable/confirmed deaths by the number of total suspect/probable/confirmed cases for the same date. This is crude and may be a sizable underestimate of the true PFC.

It may be better to use the deaths at the most recent date divided by the total cases from 9-14-days  earlier (this number is not precisely known) to better account for the lag in time between presenting to a treatment facility and dying (for those who do not recover). 

Some estimates suggest the true PFC may be closer to 80%. I don't have enough data (or smarts) to be able to calculate that for now so please be aware the PFC above is likely an underestimate


Reminders:

  • The chart above, as with all on VDU, is made for general interest only. It is also freely available for anyone's use, just cite the page and me please. It may be that I have misinterpreted the language in the reports (sometimes a little tricky to wade through) or miscalculated some totals based on the way data have been presented. 
  • Sometimes there are very country-specific differences in what gets presented to/via the World WHO DONs/SitReps which make this process less clear than it could be. I recommend you have a read and compare the data from each of the countries for yourself to understand these issues. 
  • As I've talked about previously,[1] these numbers are all volatile for a variety of reasons, some Ebola-specific, so regard this chart for its trends only.
  • I am only able to plot what is publicly available. To date, this does not include granular data with dates of onset, or daily data of any kind. The WHO have these data and you will see them become more available through their Situation Reports found here http://www.who.int/csr/disease/ebola/situation-reports/en/

References... 
  1. Ebola virus disease and lab testing...
    http://virologydownunder.blogspot.com.au/2014/04/ebola-virus-disease-and-lab-testing.html
  2. Ebolavirus outbreak Situation Reports
     http://www.who.int/csr/disease/ebola/situation-reports/en/

Thursday, July 3, 2014

Ebola Virus Disease (EVD) 2014 West African outbreak..

A new static page on which I will update the 2014 West African Ebola virus disease (EVD) outbreak numbers after they are released by the World Health Organisation (WHO).

The WHO have commenced creating multi-page Situation Reports.[2] They contain more granular data than is publicly available. They will be reported at least once per week.

If I become impatient, I'll cobble together the individual country's numbers via reliefweb.int, then update that once WHO data are available (which may result in a drop in totals as WHO numbers may have been collected a littler earlier).

Latest data taken from: http://apps.who.int/iris/bitstream/10665/135029/1/roadmapupdate26sept14_eng.pdf?ua=1
Date of DON: 26-Sept
Dates covered: 23-Sept


A note about the proportion of fatal cases (PFC): 
On these graphs, my PFC calculations for West African countries and the DRC are based on dividing the total number of suspect/probable/confirmed deaths by the number of total suspect/probable/confirmed cases for the same date. This is crude and may be a sizable underestimate of the true PFC.

It may be better to use the deaths at the most recent date divided by the total cases from 9-14-days  earlier (this number is not precisely known) to better account for the lag in time between presenting to a treatment facility and dying (for those who do not recover). 

Some estimates suggest the true PFC may be closer to 80%. I don't have enough data (or smarts) to be able to calculate that for now so please be aware the PFC above is likely an underestimate.


Reminders:

  • The chart above, as with all on VDU, is made for general interest only. It is also freely available for anyone's use, just cite the page and me please. It may be that I have misinterpreted the language in the reports (sometimes a little tricky to wade through) or miscalculated some totals based on the way data have been presented. 
  • Sometimes there are very country-specific differences in what gets presented to/via the World WHO DONs/SitReps which make this process less clear than it could be. I recommend you have a read and compare the data from each of the countries for yourself to understand these issues. 
  • As I've talked about previously,[1] these numbers are all volatile for a variety of reasons, some Ebola-specific, so regard this chart for its trends only.
  • I am only able to plot what is publicly available. To date, this does not include granular data with dates of onset, or daily data of any kind. The WHO have these data and you will see them become more available through their Situation Reports found here http://www.who.int/csr/disease/ebola/situation-reports/en/
References...

Wednesday, July 2, 2014

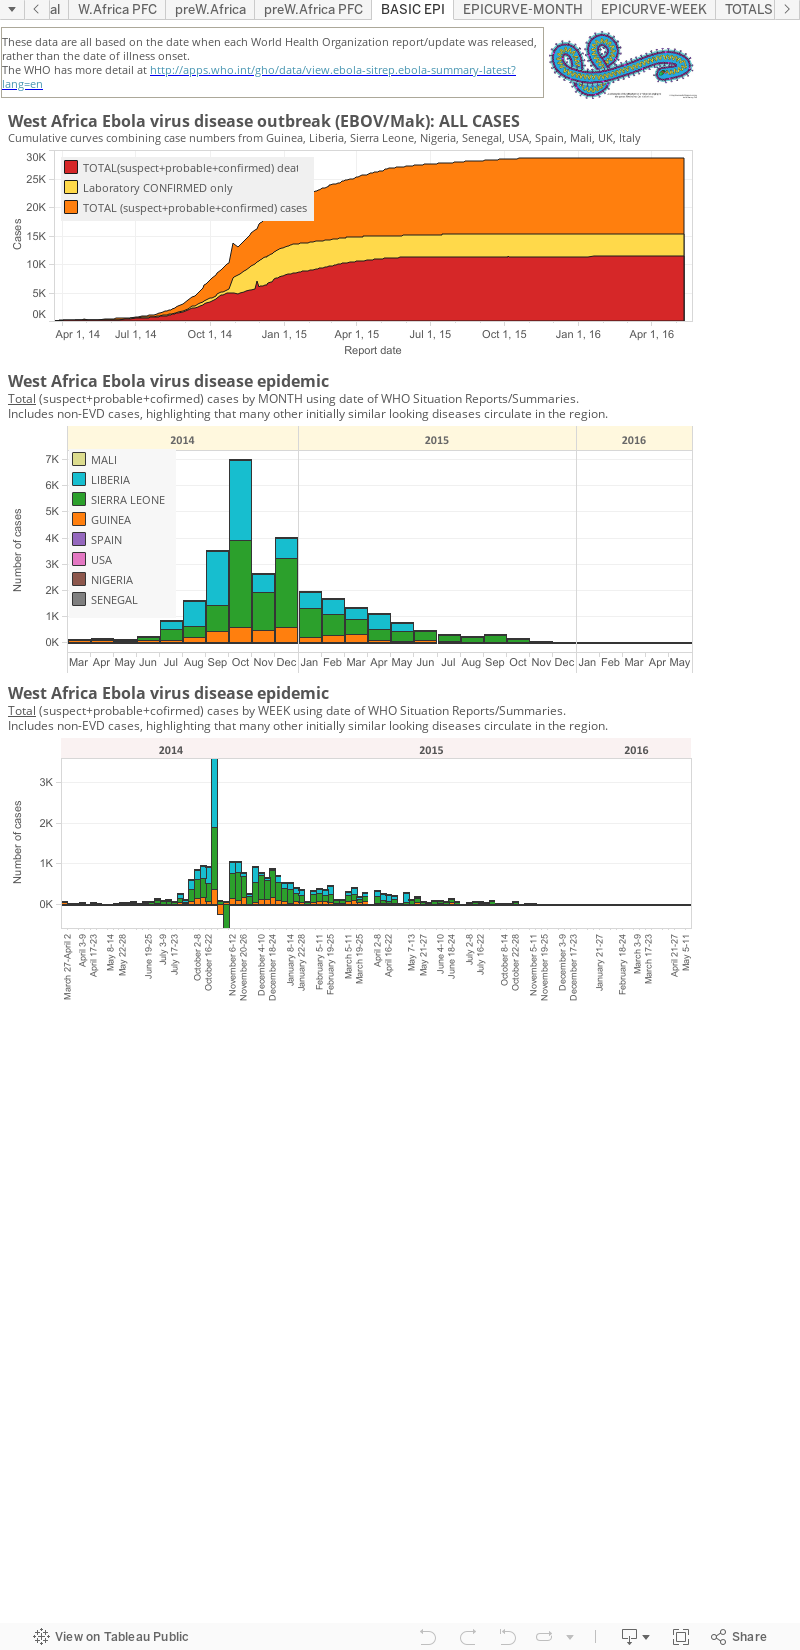
Ebola Virus Disease (EVD) West Africa update for 1-July-2014... [UPDATED]

Some quick visualizations of the Zaire ebolavirus outbreak data based, as previously,[1] on the World Health Organization's publicly available data.

The presentation below is made using Tableau, a new platform for me so please let me know of anything that has failed, numbers that are wrong, something that's translated / formatted badly on your device...whatever. Tableau certainly allows for much faster updating of charts...once you've put a leash on it anyway.

PLEASE NOTE: I now have these same data on a static page (one with a webpage address that does not change with each updated blog).
Please vist the links below for the latest EVD numbers and maps.


References...
  1. Ebola virus disease (EVD) West Africa update for 24-June, WHO-AFRO update...
    http://virologydownunder.blogspot.com.au/2014/06/ebola-virus-disease-evd-west-africa_25.html
  2. Ebola virus disease, West Africa – update | Disease outbreak news | 1 July 2014
    http://www.who.int/csr/don/2014_07_01_ebola/en/
  3. Ebola virus disease and lab testing...
    http://virologydownunder.blogspot.com.au/2014/04/ebola-virus-disease-and-lab-testing.html

Monday, June 23, 2014

Snapdate: MERS-CoV around the world...

An update of the MERS-CoV-by-country graph shows that everything is pretty quiet globally, but some cases are still being added to the total thanks to the kingdom of Saudi Arabia.

Click on image to enlarge.

Ebola virus disease (EVD) West Africa update for 22-June, WHO-AFRO update...

[CHECK OUT TAB ALONG TOP FOR LATEST EBOLA NUMBERS]

A new Disease Outbreak News has appeared. It shows that cases have risen by ~39 since the last report.

Total suspected/probable/confirmed cases: 567
Total suspected/probable/confirmed deaths: 350 (61.7%)
Total lab confirmations: 385 (67.9% of 567)


The cumulative totals of suspected/probable/ fatal EVD cases, just fatal cases and the numbers confirmed by laboratory analysis. Data are based on WHO DONs. Lines use the numbers on the vertical axis on the left, bars use the right hand axis. The percentages are the proportion of fatal cases at the time point indicated.
Click on chart to enlarge.
Reported cases continue to rise most rapidly in in Sierra Leone as we can see from the country-specific chart below..


The country-based EVD cumulative totals. Data are based on WHO DONs (see latest, [1]). Lines use the numbers on the vertical axis on the left. The percentages are the proportion of fatal cases at the time point indicated.
Click on image to enlarge.

A reminder:
The chart above, as with all on VDU, is made for general interest only. It is also freely available for anyone's use, just cite the page and me please. It may be that I have misinterpreted the language in the reports (sometimes a little tricky to wade through) or miscalculated some totals based on the way data have been presented. 
There are very country-specific differences in what gets presented to/via the World Health Organization's Disease Outbreak News which make this process less clear than it could be. I recommend you have a read and compare the data from each of the 3 countries for yourself to understand these issues. 
As I've talked about previously,[2] these numbers are all volatile for a variety of reasons, some Ebola-specific, so regard this chart for its trends only.

References...
  1. Ebola virus disease, West Africa - update (awaiting move out of the Latest News section)
    http://www.who.int/csr/don/2014_06_22_ebola/en/
  2. Ebola virus disease and lab testing...
    http://virologydownunder.blogspot.com.au/2014/04/ebola-virus-disease-and-lab-testing.html

Sunday, June 22, 2014

Snapdate: MERS-CoV in HCWs and those without symptoms

 Another quick chart update.

This shows what has been happening with healthcare workers (HCWs; Figure 1.) and asymptomatic outcomes of MERS-CoV infection (Figure 2) over time, around the world.

Figure 1. Healthcare workers shown accumulating over time (pink mountain; left-hand y-axis) and as a proportion of total MERS-CoV detections each week (pink dots linked by dashed lines; right-hand y-axis, percentage). I've also added in a cumulative average (HCWs each week divided by accumulated MERS-CoV detections at that point; right-hand y-axis, percentage)
Click on chart to enlarge.


Figure 2. MERS-CoV-positive people without signs or symptoms of illness. Numbers are shown accumulating over time (orange dots/line; left-hand y-axis) and as the number each week (blue dots/line; left-hand y-axis). I've also added in the proportion of all MERS-CoV detections in that week ,who were described as being asymptomatic (grey bars; right-hand y-axis, percentage).
Click on chart to enlarge.

This is all at the mercy of publicly available data of course, and if you've ever read this blog you'll know what I think about the quality of that for MERS! If not, read through past posts like these ones here, here or here.

Snapdate: Charting up MERS-CoV numbers..

Another quick chart update.

Nothing too drastic to add since cases have been infrequent over recent days (see previous post for recent dailies on this [1])

Same caveats apply about the found113 (they are not included here [1]).

Detections and fatal outcomes have slowed to a plateau.

Next stop, Ramadan.

Click on chart to enlarge

References...

  1. Adding in the recent MERS-CoV cases by chart...we're back to 2013
    http://virologydownunder.blogspot.com.au/2014/06/adding-in-recent-mers-cov-cases-by.html

Snapdate: MERS-CoV by month..

An updated chart. 
[SNAPDATE'S are snap updates that don't have lots of detail and chat...although they almost always end up having lots of chat!]

Unfortunately there are 23 deaths I cannot assign to cases previously announced and so they are not shown in this chart. As the new CCC format continues and there is no WHO fill-in data to help out, this will be an ever-widening gap. One of several.

Into this gap, speculation and hand-waving will exist and thrive. As always. 

Previous caveats about the found113 remain in place too.[1]

The pattern of bad communication>change>good communication>change.... just keeps cycling on in MERSville. Why do we keep resetting-isn't that the question of the day?


MRS-CoV detection by month. Please note the difference in the y-axis scales; for 2014 data, it is set at 10x that of 21012 and 2013 (350 versus 35) to accommodate the much great number of cases - as indicated by the yellow star. 
Click on image to enlarge.
If the scales are not adjusted (h/t to @doctorsdilemma for reminding me that I need to keep things clear, even in a snapdate)...the outbreak's impact is more obvious, at the expense of having any real idea of the detail. Here's how that looks though just tt make the point more clear...


References...
  1. Adding in the recent MERS-CoV cases by chart...we're back to 2013
    http://virologydownunder.blogspot.com.au/2014/06/adding-in-recent-mers-cov-cases-by.html

Friday, June 20, 2014

Adding in the recent MERS-CoV cases by chart...we're back to 2013

According to my personal list...

Total cases globally: 714
Total deaths globally: 225
Proportion of fatal cases (PFC): 31.5%

My data still do not include the found113 cases, reported by the Command & Control Centre of the Ministry of Health (MOH) of the Kingdom of Saudi Arabia (KSA; gasp) 3-June because they can't be included. They have no accompanying data apart from some of them not being confirmed/sent for confirmation, by a second laboratory. And we see how that rolls in the recent Bangladesh case hmm?

This is the latest version of the case per day charts. This have dropped to 1/case per day on some days, since 10-June. Since the 3-June, the majority of KSA dates refer to the date the case was reported (not illness onset, the preferred norm for this sort of epidemiology); dates from cases in other countries that have been filtered through eh team at the World Health Organization, are more rich in data (and include 2 of the recent KSA cases).

The trend line is not really needed but shows the steady and very linear decline in new MERS-CoV detections since the new new acting Health Minister Adel M. Fakeih, took over the MOH's reigns in late April.
Click on chart to enlarge.

Just for interest, here is the very same period from 2013. If you exclude the massive healthcare-associated outbreak that was Jeddah-2014, the cases numbers look identical. 

Click on chart to enlarge.

So now we're "back to normal" MERS-CoV detections, unless another outbreak bypasses infection control and lifts the numbers of course. I guess we now wait to hear the results from the new studies being conducted in the KSA and nearby countries. Hopefully these will better explain how "back to normal" works? Including addressing...

  • How cases keep ticking over? This will be better understood once we know what the transmission method(s) from camels to humans is(are) e.g. mucous, ingestion, aerosol, splashing, sideways glances or YouTube video creation
  • What the community seroprevalence is, both overall in the KSA and in the recent hotspots of MERS-CoV activity
  • How many camels are actively infected with MERS-CoV at any given time, how many are obviously showing signs of illness (runny noses etc) and is active infection mostly restricted to juveniles (as the research studies suggest) or can older camels be a source of human infection (less often suggested)
  • Are infected camels being imported into the Arabian peninsula from outside the peninsula (see today's Storify collection with questions and data from @influenza_bio by visiting reference [1])?
And many more questions for which I know of no specific studies under way, that may nonetheless address whether there are human infections that have been acquired from within countries with MERS-CoV infected camels other than those in the Arabian peninsula. These include Egypt, Ethiopia, Nigeria and Kenya.

References...