Showing posts with label daily cases. Show all posts

Tuesday, August 5, 2014

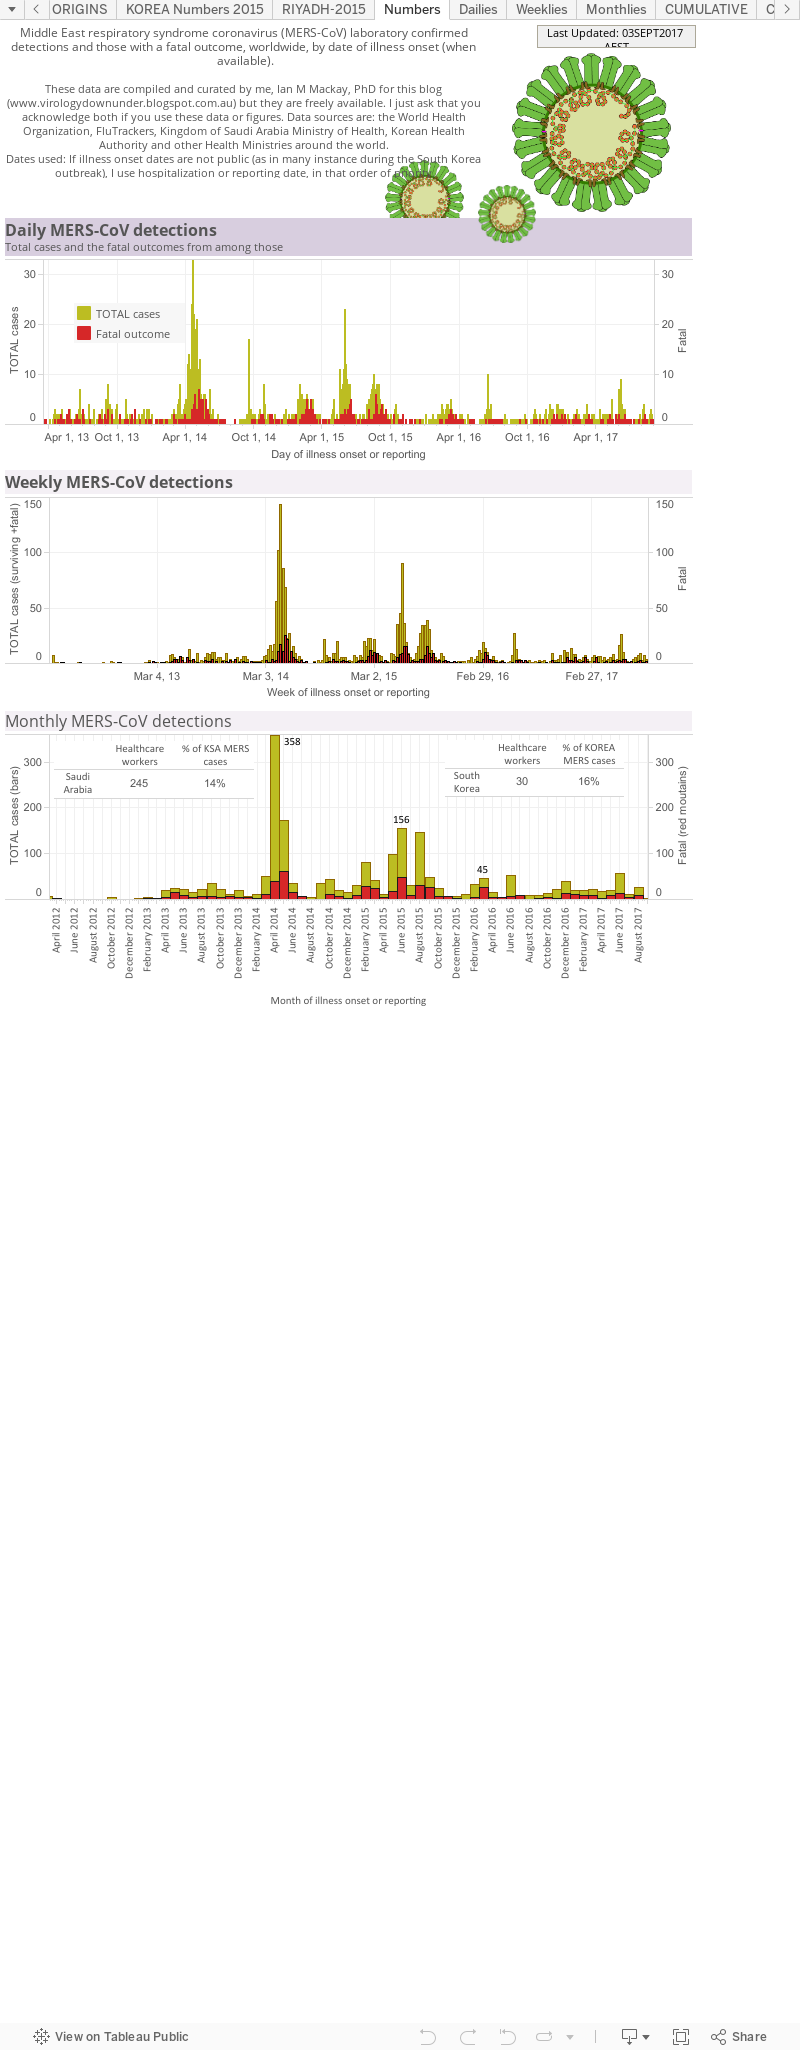
MERS-CoV daily, monthly and cumulative numbers over time...

This is a static page - the internet address won't change, just the charts as new numbers are added. The page will follow Middle East respiratory syndrome coronavirus (MERS-CoV) detections by day, month and the cumulative tallies, worldwide.


Data are derived from the World Health Organization, FluTrackers and various Ministries of Health.
The chart above, as with all on VDU, is made for general interest only. It is also freely available for anyone's use, just cite the page and me please. 

Monday, July 14, 2014

Middle East respiratory syndrome coronavirus (MERS-CoV) daily numbers...

Because I miss my charts, this is a quick one, made the old fashioned way (Excel and Adobe Illustrator).
MERS-CoV detections by date of illness onset (orange; when available, otherwise date of hospitalization or reporting) or by reporting date only (blue), each day since 22-March-2014. 
Click on image to enlarge.
A few things to note from this chart:

  • I've arbitrarily chosen to bracket the Jeddah-2014 outbreak as starting in the week beginning 17-March-2014 (MERS Week #106) and ending in the week beginning 19-May-2014 (MERS Week #114). There don't seem to be Jeddah-originating cases in the week after that, and case numbers are low (<5/day, similar to the same period in 2013) from then onwards...although this is not an exact science. For example, does one count those cases from the Al Qunfudah cluster that were moved to Jeddah hospitals? But it's a guide.
  • This chart has the daily case numbers (orange) based mostly on the date of illness onset. This highlights (again) the ongoing paucity of recent MERS-CoV detections which is great news for the Kingdom of Saudi Arabia (KSA). The map below previously posted here, does highlight an interesting questions. How are the small number of cases reported in June/July so widespread and where are the infections being acquired from? It's not spring (the camel calving hypothesis suggests human cases take off during the active birthing period; perhaps this is just the "ticking over", non-Spring norm for animal>>human acquisitions?) and there are no hospital outbreaks. Is this community spread? All the indicators we have point away from that. It is also a very busy time in the KSA right now with Ramadan having attracted visitors for some weeks. We have not yet seen cases appearing among those with underlying illness, an indicator or sentinel population for MERS outbreaks because they show the more obvious result of an infection. So these cases must be ongoing sporadic camel (or other animal, including goats which appeared in the recent WHO disease outbreak news) to human acquisition. Right? I'm looking forward to some widespread camel testing results from the KSA and some human seroprevalence studies would be very relevant too. Not sure what's taking so long for the latter to appear.
  • The plot of detection based on date of reporting (blue) is somewhat messed up by the found113 detections for which we have no date breakdown (see here for more detail or search VDU for found113). This means the detection all get assigned into 3-June, the date the KSA Ministry announced them. Yuck. It looks like those details are never going to materialize either. At least, my personal efforts to get date data from Prof Tariq Madani have failed, despite his public assurance that more detailed data could be made available to scientists who wanted it, and the WHO seem to have moved on to posting more contemporary cases in detail, skipping over the same level of detail for the found113.
The very good news is that Ramadan has not coughed up a plague of new MERS cases. The bad news is, we still don't really know the source of the cases that have been continuing to emerge in the KSA. Without knowing that we really don't have a handle on this disease, or this virus, at all.

Location of June/July MERS-CoV detections in the KSA.
Click on map to enlarge.

Monday, May 19, 2014

MERS-CoV detections: The April wave recedes...

So welcome to the 114th Week of MERS-CoV among us. That week numbering may change shortly. Stay tuned if week numbering is your thing.

We currently have a tally of 649 detections of MERS-CoV or viral antibodies in humans. I don't list camel numbers. My count says 192 fatalities among infected people, resulting in a proportion of fatal cases of 29.6%. That seems high. Because, until very recently, the Kingdom of Saudi Arabia's Ministry of Health did not regularly report deaths alongside their date of illness onset, it has been an interesting hobby to try and link them. The number is solid so along as the MOH has not been doubling up in the reporting or coming back later to re-report deaths. You'll be familiar with these issues if you follow me on Twitter.

I made a point of saying antibodies earlier because I am going to be including these sorts of laboratory data in my tally when produced by trustworthy laboratories who have described their methods and shown some validation data and an understanding of what the cross-reaction issues are when dealing with MERS-CoV serology. This will be despite the current WHO MERS case definition not allowing for inclusion of people who only have antibody but no virus or viral RNA detected in their samples. There may be some hiccups with MERS-CoV antibody testing along the way, but we need these data in humans and it's good to see the wheels rolling on this at last.
[One of those hiccups occurred 28-May-2014, when the test result from an Illinois man who had originally tested positive in an Ab test, was retracted.]

In my estimation though, serology (the testing of human sera for antibodies against a virus here, the main target being IgG which takes a couple of weeks to become detectable after infection) is a much more reliable way of defining an infection by MERS-CoV virus than by relying on patient recall bias of symptoms 2-weeks ago, or from directly observing signs and symptoms that are nondescript and difficult to distinguish, alone. The latter approach has been the mainstay of identifying cases of human infection for a very long time; still is. This approach is especially important during times of outbreak and pandemic when labs are swamped by testing requests and it must be assumed that cases are due to the bug of interest; if it looks like a camel, slobbers like a duck and walks like a duck, then it is a MERS-CoV infection yeah? No. If you can clinically characterise and laboratory test then you will more often know the virus the patient has/had than if you don't test. But I'm sure that's clear to everyone anyway.

For MERS, as for H1N1pdm09 influenza and perhaps SARS, finding a reliable pathognomonic set of signs or symptoms capable of reliably distinguishing a respiratory virus of interest from another virus capable of the same disease is not possible. These viruses cause a spectrum of illness. Testing is paramount if you want to know what's there and to address other aspects relevant to public health during an infectious disease cluster/outbreak/pandemic. There are a couple of issues here (at least!)...

From a patient management perspective, who really cares what is making my patient very ill anyway? It really doesn't matter right now if it's this respiratory virus or that one; there are few vaccines and I don't have an antiviral for most of them anyway. I and my healthcare team are already taking respiratory infection precautions and I just want to direct my supportive therapy and resources to the problems they have, right? I'll be (well...you, experienced medical types of which I am not one) doing that before many lab results show up anyway. 

From the perspective of interrupting and understanding viral transmission however, nondescript signs and symptoms are a nightmare. And in the early days of a new virus where we seem to know very little about what path(s) transmission is taking (and perhaps we're also learning some more about those possibilities in general), any infection by whatever method it is empirically determined should, I believe, be recorded as an infection in order to provide the biggest picture possible; a process we have seen unfolding in the United States with its 2 3 detections (1 locally transmitted) of MERS-CoV or its spiky little footprints.
THIS RESULT WAS RETRACTED 28-May-2014 FOLLOWING A NEGATIVE NEUTRALIZING ANTIBODY TESTING.

Given that many viruses cannot be distinguished by signs and symptoms alone, a clinical diagnosis to define a case is less reliable than any pathogen-specific laboratory test. I hope the WHO alters their case definition in the near future. Infectious disease is always teaching us - seems we learned a heap from SARS but even the relatively a few cases of MERS are presenting interesting issues and testing us in new ways. 
[While the US antibody-positive result above has since been retracted, I stand by these comments-Ab testing requires rigor, but that can be provided using several assays and applying a good understanding of Ab technologies and limitations to produce reliable results]

Anyhooooo...been stewing on that for a few days apparently. Let's move on and have a look at the 3 updated charts below. 

We are definitely through to the other side of the Jeddah outbreak (see weeklies chart). While cases do keep accruing each and every day (see dailies chart from 20-March), the downward trend of smaller numbers of illness onsets each day also continues. 

Weekly MERS-CoV detections.
Click to enlarge.

Daily MERS-CoV detections from 20-March.
Click to enlarge.

For perspective on the size and the influence of what 1 hospital cluster can turn into and how that can influence how a virus "looks", take a gander at the extent of the April outbreak. Case are still falling out into April as we get more data. If you look at the monthlies chart at the bottom, I've readjusted that y-axis scale again such that it's maximum value is now 10x higher (350 vs 35) than the scale used for 2012 or 2013's charts. May's tally is currently 4x greater than any month from 2012 or 2013. 

What does MERS-CoV hold for us in the coming months? 

Daily detections of MERS-CoV, 2012-current.
Click to enlarge. 

Monthly detection of MERS-CoV 2012-current.
Click to enlarge.


Monday, May 5, 2014

Snapdate: MERS-CoV detections near 500...

MERS-CoV detection by day; Jeddah outbreak.
Click on image to enlarge.
Welcome to the beginning of MERS-CoV's 112th week (2.15 years). We sit at 497 cases (probably over 500 if the United Arab Emirates would confirm their cases with some extra data that made them more identifiable and "real". For now, I'm not including them after the recent issue around theUAE12. For now my count says at 497 with ~131 deaths (26.3%).

Judging by tonight's announcement of only 3 cases (only 1 with an onset date which was 24-Apr), let's hope this is the week where the Jeddah outbreak gets put to bed.

MERS-CoV detection by week 2012-present.
Click on image to enlarge.
Also, make this the week that the Kingdom of Saudi Arabia's(KSA) Ministry of Health adds some consistency to its releases. They've been doing a 100% improved job in the past weeks, adding much more detail, but it needs to be the same detail for every case, every day. And the listing of deaths and recovered cases is also great; but is currently not able to be linked to the original announcements so we don't know where they these people were from, comorbidities, HCWs etc as there are often 2 or more people from the same region with the same age. A date of affliction is needed to permit the linkage between original announcement and death/recovery. Just 1 more variable guys. Pleeease.

Nonetheless the dailies seem to be slowing, although the cumulative average still strolls upwards but in a linear, not exponential manner.

We stay tuned.


Sunday, May 4, 2014

MERS-CoV by month, now with added camels and hospital outbreaks...

Weekly case tallies for 20012-4 (blue-surviving 
and fatal cases; red-fatal cases). Also indicated 
are the season in which camels give birth (I've
noted "birthdays" because it seems to be 1-year

old or older camels that are usually positive for
MERS-CoV. Past and future Hajj pilgrimage 

dates are also shown as is 1 of several
large camel events in the KSA.
Click on image to enlarge.
While the World Health Organization is yet to produce confirmed case data for the majority of the MERS-CoV outbreaks' biggest month, some of those data and extra information are being provided by the Kingdom of Saudi Arabia Ministry of Health v2.0. 

And it's very welcome and much appreciated. There still remain some vagaries and data gaps that make consistency an issue. But further information is not forthcoming so let look at some charts of what we have. 

For now, we can see in the daily graph, 4-days into May, that cases are still being announced but at what looks like a slower rate. We are seeing cases reported with a lag of approximately a week from when they became ill/were hospitalised (when those dates are present).

A plot of cases per day. Many (?most) are based on dates of reporting although
more dates of illness onset have emerged lately and I am working through them. This means that the specific peaks may chop and change a little as dates are assigned. Nonetheless, the trend seems to be one of decreasing numbers per day and
the cumulative average may be suggesting a peaked for this KSA outbreak.
Click on image to enlarge.

Monday, February 10, 2014

H7N9 by day: 10 disease onsets per day is the current peak..

Click on image to enlarge.
This builds on my two recent posts with cases per day data posted here and here.

Today it would seem that 27-Jan surpassed any previous day's total case number with 10 disease onsets on the 1 day. By the way, cases are still being found that became ill on that day

The previous "record" had been 8 cases in a day in 2013 and 2014. You can see that in the raw daily data (black line, grey circles).

The current average for 2014 is 4.3 cases per day. From 1-Jan to 27-Jan it sits at 5.5 cases per day. From 28-Jan to 10-Feb the average is 2 cases per day. However, not much can be concluded from the reducing averages yet since cases becoming ill during those days are still coming in. 

As we've read elsewhere, there have so far been 31 cases in January; the worst H7N9 month to date. But the case tally is unfinished. There is still an 8-day laboratory result turnaround to consider. There will be more to add to January yet.

Its hard to tell yet, but I cannot see a clear indication of market closures having had an impact. Certainly nowhere near the impact seen in 2013 when human case numbers precipitously declined within 2-3d after markets closed. More on this in another post later.