Showing posts with label EVD. Show all posts

Tuesday, September 30, 2014

The United States of America is the 6th country to host a 2014 West African Ebola virus variant..

v2 01102014 5:51pm AEST
First thing...
CALM DOWN!

This is the first case of Ebola virus infection to arrive in the United States that was not deliberately flown in. Its not the first viral haemorrhagic fever case though (1 case of Marburg virus disease and at least 4 Lassa virus infections and the Reston ebolavirus outbreak among imported animals[3,5]), and none of the earlier infections resulted in secondary transmission among humans; no-one else got infected from by the case.[4]
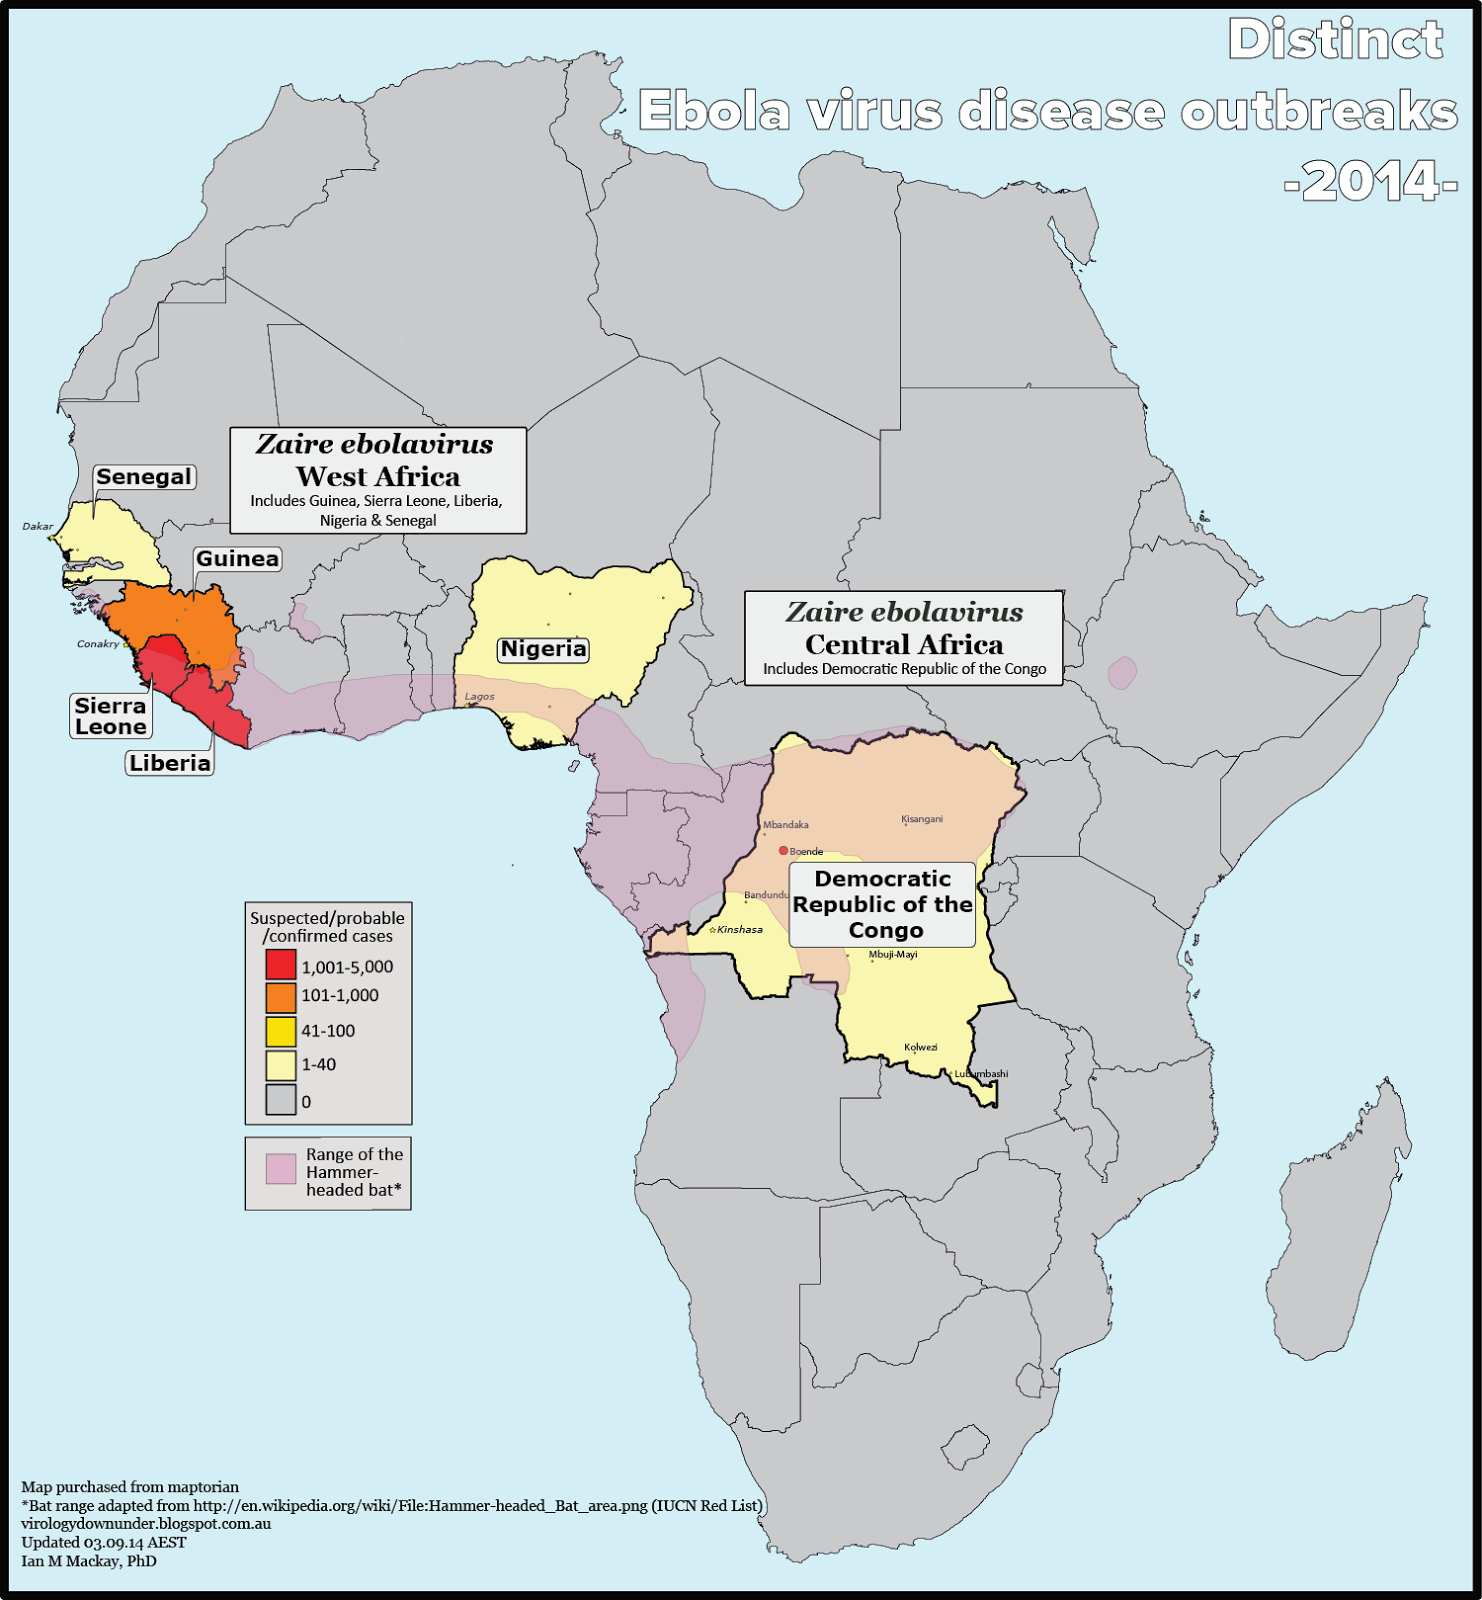
Countries that have hosted people infected
with the Ebola virus variant causing the
& 2014 West African Ebola virus
disease epidemic.
Click on image to enlarge.

The male is in critical condition.
When he flew from Liberia to the United States (finally arriving in Dallas,Texas). The man was not showing signs of disease when leaving Liberia or on the plane or immediately after arriving.[6]

This means that the man was not infectious - he could not spread it to fellow travellers or airport workers - because it is well known that disease in another does not develop due to virus being shed before disease is obvious in the infected person.

Briefly[1,2]:
  • 19th: Departed Liberia, checked and found to be symptom-free
  • 20th: Arrived in Dallas, US (connecting flights?)
  • 24th: Started to develop symptoms
  • 26th: Initially sought care
  • 28th: Admitted to hospital in Texas.
  • 30th: Texas public health laboratory found Ebola virus this morning of 30th Sept. CDC received samples, tested and confirmed as Ebola virus disease
  • Patient is ill and is under intensive care

US family and community contacts (a "handful") are known or being traced and will be under observation/monitoring for 21-days (~21-Oct) for fever. Will any become positive for Ebola virus? Perhaps. I look to Port Harcourt (Nigeria) for some comfort. There were around 60 "high risk" contacts of there and they did not all become ill.

So now we have evidence that supports all those talking heads (me included) who noted that it was possible for sporadic cases of EVD to be imported into countries outside of those in West Africa (Guinea, Liberia, Sierra Leone, Nigeria, Senegal). 

Soon, I very much believe, we will also have evidence that in richer countries with functioning healthcare systems, a good knowledge of what is needed to contain virus infections spread by all possible routes, stocks of the necessary personal protective equipment needed to protect healthcare workers from nosocomial infections and the training to use those stocks...to support that even when such cases arrive, they do not result in outbreaks.

References...
  1. https://www.youtube.com/watch?v=6Bxencye1cg&feature=youtu.be
  2. http://www.nytimes.com/2014/10/01/health/airline-passenger-with-ebola-is-under-treatment-in-dallas.html?partner=rss&emc=rss&smid=tw-nytimes
  3. http://scienceblogs.com/aetiology/2014/08/02/ebola-is-already-in-the-united-states/.
  4. http://blogs.scientificamerican.com/molecules-to-medicine/2014/09/30/ebola-in-usno-need-to-panic/?WT.mc_id=SA_sharetool_Twitter
  5. http://www.cdc.gov/media/releases/2014/s930-ebola-confirmed-case.html
  6. http://news.sciencemag.org/health/2014/09/one-more-ebola-question-dr-frieden-answers-journalists-would-have-first-u-s-case?rss=1

Monday, September 29, 2014

The control gap...

v2 300914
I have a theory.

This theory is meant only to apply to disease outbreak/epidemic/pandemic situations, and then only to those which include fatal cases.

This theory of mine has only emerged since I've been plotting Ebola virus cases numbers from the West African epidemic. I precede the explanation with the caveat that there is very probably already a well developed, well-known actual epidemiology term to describe this theory. But I'm not a trained epidemiologist and this is just a blog, so please forgive me my ignorance.

The theory goes that when a gap grows between the number of new cases being reported and the number of deaths or laboratory confirmations in that population, despite the outbreak having been going for a while, this represents an indication that control of the situation is slipping, or has been lost. 

Mind the gap.

This "control gap" - my term, so don't expect to find it anywhere official or that knows of that which it speaks - can also appear when looking at suspected or probable cases of disease X, and the number of those that have been confirmed by a laboratory test.

Other explanations for the control gap may exist of course; testing may be scaled back deliberately, reporting of deaths may have been deliberately throttled for some political reason. So it may not reflect being "out of control" as much as someone else being "in control".

Probably still more variations that I have not thought of at all.

Ebola virus disease (EVD) in Liberia.

In the graphics below I've used the accumulation of World Health Organization data for Liberia, up to 23-Sept. 

First up - the fold increase in total case numbers (suspect+probable+laboratory confirmed) compared to the fold-increase in the distance between that total and the total number of laboratory confirmed cases alone. This distance, or the "control gap|lab", has widened over time. It has widened because total cases have climbed more steeply than the number given a laboratory confirmed diagnosis of EVD. 

For whatever reason(s), laboratory confirmations are not keeping pace with the total case numbers, and they seemed to start slipping at the end of July. 

I suspect a principal reason - and I'm not on the ground of course, so this is all speculation and second-hand knowledge - is that laboratory capacity is overwhelmed. 

Other reasons include that samples might not always be collected or that many recent clinically defined EVD cases are actually due to something clinically similar to EVD, but not an Ebola virus infection. If it were this last one though, the total numbers would be readjusted downwards as new diagnoses were made...if the laboratory has time to make those of course...so I doubt it as a major role.

The control gap|lab
A.) Ebola virus disease case graph for Liberia showing the accumulation of total (suspect+probable+laboratory confirmed) cases (pink line; left y-axis) and deaths (blue line; left y-axis), the laboratory confirmations (green line; left y-axis) and the proportion of fatal cases (right y-axis) at each reporting date (x-axis). The size of the gap between laboratory confirmed cases and total cases is indicated for a range of reporting dates, using a vertical green drop-line.

B.) The drop-lines have been copied and aligned and the amount they have grown has been measured using a scale bar so that the fold-increase can be compared to the first reporting date used, 8-July. The fold-increase value is written at the top of each drop-line. Along the bottom (enclosed within a grey box) are the case numbers at each reporting date examined and the fold-increase (in bold) compared to the 8-July baseline.


Next up -the fold increase in total case numbers (suspect+probable+laboratory confirmed) compared to the fold-increase in the distance between that total and the total number of deaths. The control gap|deaths comparison finds that the deaths and the total cases don't diverge as much as total cases and lab confirmations do. 


The control gap|deaths
A.) Ebola virus disease case graph for Liberia showing the accumulation of total (suspect+probable+laboratory confirmed) cases (pink line; left y-axis) and deaths (blue line; left y-axis), the laboratory confirmations (green line; left y-axis) and the proportion of fatal cases (right y-axis) at each reporting date (x-axis). The size of the gap between laboratory confirmed cases and deaths is indicated for a range of reporting dates, using a vertical blue drop-line.

B.) The drop-lines have been copied and aligned and the amount they have grown has been measured using a scale bar so that the fold-increase can be compared to the first reporting date used, 8-July. The fold-increase value is written at the top of each drop-line. Along the bottom (enclosed within a grey box) are the number of deaths at each reporting date examined and the fold-increase (in bold) compared to the 8-July baseline.

So with that visualization under our belt, there is another, less laborious way to look at this, by graphing the numbers, rather than the gaps.

What we see when we plot the fold-change values against report date is that total cases lost control as we suspected, but deaths are less obviously out of control. From 9-Sept onwards the gap has widened a little more consistently. Before that though the deaths did not dramatically drift away from the rate at which new cases were being added.

I'll graph Sierra Leone, Guinea and Nigeria in the next day or two. Nigeria should serve as an example of how this looks for a country in which EVD is definitely in control. 


Graphing the control gaps


Friday, September 12, 2014

The wind beneath my Ebola virus.... [UPDATED]

Only a couple of weeks ago the report in Science presented 99 genomes representing some of the thousands of those circulating in Sierra Leone this year.[1] I say thousands because each infected person has a range of subtley different viral variants among the billions of viruses per millilitre of blood that all compete to be the champion. The words "mutant" and "ebolavirus" are now hard to avoid. And of course as soon as you talk mutations, you can only see one endgame - a virus that is easily transmissible and turns us all into zombies. spreads across the world in a pandemic and kills as many as 80% of those it infects. Yes, its seems the proportion of fatal cases (PFC) in West Africa may not be as simply calculated as most of us were thinking these past months. When we take into account that Ebola virus disease deaths occur in people that were part of a case tally days earlier (if they were counted of course) when the total case numbers were smaller, the PFC inflates. How much, we don't really know.

And so the story of mutants was brought full circle today thanks to Dr. Michael T. Osterholm. In a very nicely written piece for the New York Times,[2] Dr. Osterholm, ventured behind the scenes to crack the door into the world of whispered discussions, shadowy frappé meetings by chino and beige blazer-wearing figures, many of whom were men with with thinning hair. Yes, he found where the real virologists hang out and what were they discussing at length? Why they were talking about how soon it would be until Zaire ebolavirus was going to mutate and become an airborne killer virus identifiable only through watching big wall-mounted LCD screens as they are rendered in red because of the fusion of rapidly growing dots, spreading across a map of a world filling rapidly with infected hosts. Or red dots. Or something. Okay, some of that was from me.


Only problem is, I think he may have entered the tinfoil hat room next door to the (but very similarly attired) room full of virologists. Maybe not. Hard to tell sometimes. But seriously.


For sure, a virus changes over time. It will change randomly through mutations that happen because viruses, especially those with genes/a genome made of RNA, are always making errors in their gene/genome copying and sometimes those errors make the virus better at something. Viruses may hold on to those changes in response to all sorts of pressures on them. These genetic sequence changes sometimes results in change to the proteins that make their structures and enzymes. Sometimes the changes may revert back as pressures go away or new ones come to be. It's a constant micro-environment of change; evolution on fast forward.


We should also keep in mind ebolaviruses didn't come down in the last shower. They are viruses that are happy in their own envelopes...and natural host(s). But mutational changes can impact on how the viral "bits" assemble and release from the cell and perhaps on how the virus causes disease, where virus replicates in the body, how it interferes with the host immune system's attempts to interfere with it, how hardy it is, how well it replicates in response to temperature and so on. 


A virus doesn't "think" about any this of course. It doesn't plan to do the nastiest thing to us that we can imagine when it jumps into us from an animal (a zoonosis). Headlines might make you think otherwise. These changes happen because, in a new host species producing many subtley different viral variants all vying for supremacy, the virus with the mutation(s) that allow it to get out from under some sort of controlling pressure or to do something better than the earlier viral versions, wins the day. The winner thrives, makes more of itself or does it better, and passes to new hosts.


A virus may keep more of these mutational changes while it is "settling in" to a new animal host species if they help that process. It may be under more pressure to adapt to slightly different environments, different receptor structures, temperatures, immune responses - all sorts of things may created a different environment from the one the virus came from and so it may need to make use of more mutations in order to "find its footing". Or fail and not find a home in the new host.


There can be all sorts of new and negative pressures to try and avoid or adapt to for a virus. So ebolaviruses seem to naturally infect bats, not us, and in bats the infection does not seem to cause a whole lot of disease. Of course we don't know a whole lot about how bats spread virus among themselves. Perhaps they do it via an airborne route. The theory then goes that humans or other forest animals including chimpanzees, gorillas, porcupines and antelopes may eat the bats or bat/virus-contaminated fruit. We, and those animals, do get sick.


Another unsure thing, a sizable knowledge gap you might call it, is whether an ebolavirus would actually be under any pressure at all to keep the mutations that change its proteins, site of replication and disease course which result in it being:

  • More stable in dried droplets
  • Shed in higher concentrations from the upper respiratory tract
  • Able to trigger more coughing or sneezing.
Each and all of these major changes might be necessary to create the mythical airborne Ebola virus. The outcome? Creation and propulsion of more droplets from an infected human, that dry down and linger in the air (the airborne part) while still containing infectious ebolavirus, and enough of it to result in human infection and disease. Phew. That is an unbelievable series of huge changes, even for a "sloppy" replicating RNA virus. 

I think we all understand that a virus doesn't "know" that these changes would provide better spreading outcomes and we now know that Ebola virus already spreads very well between bats and in humans (see the West Africa outbreak numbers which have not at any time been linked to a different or unusual spread of virus compared to any earlier outbreak[11]). To date, airborne spread has never been found to happen naturally in the dissemination of Ebola virus disease in humans. That is some kind of significant considering it does not take a lot of virus to start an infection through direct contact and considering there have been non-human primate transmission chains in the forests for a long time.

Each of those changes to the virus and the host's disease might happen by a series of accumulating mutations over time. But is their pressure to keep each of them? And really to be airborne, these changes would need to co-occur and do so without any trade-offs that meant the 'new airborne virus' was negatively impacted in some other area of its attachment, cell entry, replication, interference with the immune response enzymatic efficiencies etc. 


We do already know that in the lab, under laboratory conditions, with lab animals, lab equipment, plenty of lab-grown virus and a closed space with a lot of aerosol (probably some of which is wet droplets, not just droplet nuclei, meaning not truly airborne conditions), an Ebola virus can be forced to infect non-human primates. I've written about that previously.[3] 


And yet even when it was sought, no sign of such airborne infection has been found to occur naturally among humans. Direct. Contact. 


So I think it was a stretch to expend so many words on the chances of an airborne virus emerging rather than one that causes more bleeding, or less diarrhoea, or more vomiting, or more shedding in sweat, or having lower viral loads, more rash, more hiccups etc. 

Many additional things could result from mutational changes. We know next to nothing about the mutations recorded from the 99 genomes in Sierra Leone.[1] So why all this focus on one specific yet really quite complex outcome of viral air travel instead of many/any others? I don't know. But hey, now we have indeed been able to talk about this aspect some more, so good one Dr O! 


Others have come out to comment too. 


  • Dr Anthony Fauci, director of the National Institute of Allergy and Infectious Diseases in the US noted that "it’s fundamentally unlikely"[9]
  • Dr Amesh Adalja, University Pittsburgh said "it may not be the best path for the virus to take"[10]
  • Dr Derek Gatherer of Lancaster University in the UK noted an airborne Ebola virus would need a "conjunction of coincidental, unlikely events" [10] 

  • Dr David Heymann, Chair of the Health Protection Agency in the UK stated "No one can predict what will happen with the mutation of the virus", reminding us that "The virus's epidemiology is consistent with transmission via bodily secretions and excretions, which is exactly the same as other past epidemics".[11]
  • Prof Vincent Racaniello, a virologist at the College of Physicians and Surgeons at Columbia University stated "We have been studying viruses for over 100 years, and we've never seen a human virus change the way it is transmitted."[12]

Dr Osterholm did hit some other nails flush with the timber though. West Africa needs fewer promises to defeat Ebola virus and more plans that include actual rapid mobilization and on the ground experienced leadership to make inroads into getting beds for sick people and tracing contacts. Two key items on a long list of things to do better (in my opinion).

Thankfully some promising signs are appearing. The scope of this outbreak has now been guesstimated - 20k-100k cases.[4,5,6,7] I list this range rather than extending it to much higher levels [8] because I do still have hope that things will improve and interventions will turn the exponential case growth curves away from the sky and back to the horizon, sooner rather than before entire nations are destroyed. Because that's what is coming without successful intervention.


Money is being freed up and arriving from all over and more resources are slowly moving in to the region. Resources needed just to keep the people safe who have come from all over the world, including the nations of Africa, to care for the overwhelming numbers of sick and sickening people. Not to mention the money needed to prevent more infections. More specific and insistent pleas for defined numbers of healthcare professionals are also being broadcast. Drugs and vaccines are closer than they have ever been to use in humans. They may be our only hope to stop this virus.


If the many thousands of people predicted to die from a virus that is killing 4 in 5 confirmed cases (see the Medicins Sans Frontieres tweet below) is not enough reason for stopping the spread of Ebola virus, then stopping this particular evolving variant before it does change into something worse or more ingrained to the communities all over Africa and beyond, really is. 


While this Ebola virus variant may never make the changes necessary for it to go airborne, it has shown signs of relatively rapid change and that was relatively early in what looks to be a very long chain of human-to-human-to-human-to-human... transmission. Each person allowing the virus to adapt further, if that's what it needs to do.


Such a long transmission chain, from 1 animal>human infection, has never been recorded before and so we are indeed in new territory when it comes to the ebolaviruses. For now at least, the Ebola virus in 5 countries in and around West Africa has the upper hand. This tiny self-assembling unthinking, randomly mutating thing is totally dependent on our cells to replicate itself - and we are not doing enough to starve it of those cells. 


It clearly doesn't "need" to be airborne to spread efficiently.


References...
  1. http://www.sciencemag.org/content/345/6202/1369
  2. http://www.nytimes.com/2014/09/12/opinion/what-were-afraid-to-say-about-ebola.html?smid=tw-share
  3. http://virologydownunder.blogspot.com.au/2014/08/ebola-pigs-primates-and-people.html
  4. http://currents.plos.org/outbreaks/article/estimating-the-reproduction-number-of-zaire-ebolavirus-ebov-during-the-2014-outbreak-in-west-africa/
  5. http://currents.plos.org/outbreaks/article/obk-14-0036-early-epidemic-dynamics-of-the-west-african-2014-ebola-outbreak-estimates-derived-with-a-simple-two-parameter-model/
  6. http://healthintelligence.drupalgardens.com/content/predicting-number-cases-ebola-virus-disease-outbreak-countries-widespread-and-intense
  7. http://news.sciencemag.org/health/2014/08/disease-modelers-project-rapidly-rising-toll-ebola
  8. http://www.dw.de/ebola-threatens-to-destroy-sierra-leone-and-liberia/a-17915090
  9. http://time.com/3342305/airbone-ebola-not-happening/
  10. http://news.yahoo.com/could-ebola-become-airborne-153701091.html
  11. http://www.dailymail.co.uk/health/article-2753421/Real-risk-Ebola-virus-mutate-AIRBORNE-disease-expert-warns.html
  12. http://www.vox.com/2014/9/19/6543157/ebola-is-unlikely-to-go-airborne

Friday, August 29, 2014

The fifth I give you...[UPDATED]

Senegal. 
According to it's Minister of Health, Awa Marie Coll Seck[1,2], a case of Ebola virus disease (EVD) has been imported from Guinea and it is confirmed by testing at the World Health Organization's collaboration Centre, the Pasteur Institute in Dakar.


Interesting that this occurred one week after Senegal closed its borders (again) with Guinea.[3,4] The infected 21-year old Guinean student travelled on 21-August to Dakar. On the 23rd he presented to a hospital but did not admit to being in contact with known EVD cases; Guinea issued an alert that a person with EVD contact has escaped surveillance 27-Aug; Senegal closed its borders around 22-August.[5,6,7,8].
[WHO Disease Outbreak News places his movements ahead of the closure of the border, arriving in Senegal 20-Aug [8]]

These borders are leaky and so the effect of "closure" essentially hinders aid, trade and economy (all very important to the region, especially right now) but very clearly does may not stop the spread of human hosts-as we have seen here


Humans are the variable in outbreaks. 


They behave differently each time. 


They respond differently each time. 


This is why no two outbreaks are identical. 


It's why you're a mug to assume this outbreak will be like the last outbreak.


While it looks like this is now a case study in why closing a border is ineffective, I maintain a position that border closures can't contain infectious disease. And please, do not point me to "temperature measurement" as a way to ensure capture of infected individuals. You could easily be harbouring an infection that does not yet express the symptom of fever. 

Click on image to enlarge. 
Graphic lifted from a great CNN video narrated by
Dr Sanjay Gupta. The video describes an example of
contact tracing and its importance to the fight
to contain EVD.[2] 

The contact tracing starts in Senegal now. A 42-day clock starts for the country and a signs and symptoms watch continues on all this case's contacts for 21-days.

References...
  1. http://in.reuters.com/article/2014/08/29/us-health-ebola-senegal-idINKBN0GT1CD20140829?feedType=RSS&feedName=health&utm_source=dlvr.it&utm_medium=twitter&dlvrit=309303
  2. http://edition.cnn.com/2014/08/29/health/ebola-outbreak-senegal/
  3. http://www.washingtonpost.com/news/world/wp/2014/08/29/the-ebola-virus-has-spread-to-senegal-as-the-deadliest-outbreak-in-history-gets-worse/
  4. http://www.washingtonpost.com/world/africa/alarm-grows-as-ebola-outbreak-spurs-more-flight-cancellations-border-closures/2014/08/25/87e6d020-2c66-11e4-994d-202962a9150c_story.html
  5. http://www.bbc.com/news/world-africa-28893835
  6. http://fox59.com/2014/08/22/senegal-closes-its-borders-with-guinea-over-ebola-fears/
  7. https://www.internationalsos.com/ebola/index.cfm?content_id=434&language_id=ENG


Saturday, August 23, 2014

Fake/wrong Ebola virus disease images...

As if there isn't enough misery in the world that we need add false imagery to the mix.

Fake or hoax or just plain misunderstood images purporting to be from cases of Ebola virus disease are everywhere at the moment. The ones below are images I see regularly in the #ebola Twitter stream. 

I had once before found the real image of the first picture using a reveres image searhc on Tineye or Google's image search, but lost it until I recently downloaded my Twitter history and did a manual search for the words I thought I'd used. Bazinga! 

I'll add to this page as I find references for other fraudulent imagery. Feel free to send me other fake Ebola-related images (with the original source) and please use this page to throw at people using these images.

While I suspect much of this is just retweteed out of a lack of information, I'd ask that people check before they propagate this sort of stuff. It may dissuade others in the affected regions from seeking medical attention if they think they have been exposed because "If I don't look like that then I can't have an Ebola virus infection!"


NOT EBOLA VIRUS DISEASE
Figure 1. This is from a patient with which has haemorrhagic
bullae simulating purpura fulminans...whopping great blood
blisters and tissues that have been bled into. Image comes
from a case of leukaemia cutis published in the Indian Journal
of Dermatology, Venereology and Leprology in 2010 by
Misri and colleagues
.
Pubmed


NOT EBOLA VIRUS DISEASE
Figure 2. This is from a boy with smallpox disease. It can be found 

NOT EBOLA VIRUS DISEASE
Large hemorrhage on arm of dengue patient
Figure 3. This is bleeding under the skin in a patient with dengue
hemorrhagic fever. The image can be found on the National Institute
of Health's National Institute (NIH) of Allergy and Infectious
Diseases (NIAID) website
.
NOT EBOLA VIRUS DISEASE
Figure 4. This may be an allergic reaction, possibly 
to contact with poison ivy. I'm not as sure about the source
of this one. Some possible places include:
http://poison-ivy.org/
http://gloriousconfusion.squidoo.com/poisonous_plants_lily_of_valley_ivy_foxglove_digitalis
http://en.wikipedia.org/wiki/Contact_dermatitis
http://hardinmd.lib.uiowa.edu/dermnet/poisonivy1.html

UNSURE


Figure 5. I can only find ebolavirus-related results for this. 
If anyone can confirm or debunk it as being a valid EVD image, I'd 
be grateful if you could tell me.

Sunday, July 27, 2014

Ebola West Africa numbers in context...[AMENDED]

A quick glance at how the suspect, probable and laboratory confirmed (susp/prob/conf) cases of Ebola virus disease (EVD) stack up in the 3 countries with local spread of Zaire ebolavirus.

Please note that I have separated Guinea-2014, Sierra Leone-2014 and Liberia 2014 only to highlight that each country in the single "West Africa" outbreak (involving a single viral variant as far as we know) has greater case numbers than those found in many of the earlier outbreaks.

I have not yet listed the case imported to Nigeria here.

Click on chart to enlarge.

Thursday, July 10, 2014

Ebolavirus disease (EVD) cases, clusters and outbreaks mapped out...

The West African region outbreak (top map) and the totals from past Ebola outbreaks and the few imported monkey cases (the US & Philippines; hence zero human cases) plotted by total numbers and country (bottom map)

These maps are best viewed alongside my Ebola numbers page found here.


The WHO have commenced creating multi-page Situation Reports.[2] They contain more granular data than is publicly available. They will be reported at least once per week.


If I become impatient, I'll cobble together the individual country's numbers via reliefweb.int, then update that once WHO data are available (which may result in a drop in totals as WHO numbers may have been collected a littler earlier).

This is a static page - it will be updated with new numbers but the website address will remain the same.

Latest data taken from: http://apps.who.int/iris/bitstream/10665/135029/1/roadmapupdate26sept14_eng.pdf?ua=1
Date of DON: 26-Sept
Dates covered: 23-Sept


A note about the proportion of fatal cases (PFC): 
On these graphs, my PFC calculations for West African countries and the DRC are based on dividing the total number of suspect/probable/confirmed deaths by the number of total suspect/probable/confirmed cases for the same date. This is crude and may be a sizable underestimate of the true PFC.

It may be better to use the deaths at the most recent date divided by the total cases from 9-14-days  earlier (this number is not precisely known) to better account for the lag in time between presenting to a treatment facility and dying (for those who do not recover). 

Some estimates suggest the true PFC may be closer to 80%. I don't have enough data (or smarts) to be able to calculate that for now so please be aware the PFC above is likely an underestimate


Reminders:

  • The chart above, as with all on VDU, is made for general interest only. It is also freely available for anyone's use, just cite the page and me please. It may be that I have misinterpreted the language in the reports (sometimes a little tricky to wade through) or miscalculated some totals based on the way data have been presented. 
  • Sometimes there are very country-specific differences in what gets presented to/via the World WHO DONs/SitReps which make this process less clear than it could be. I recommend you have a read and compare the data from each of the countries for yourself to understand these issues. 
  • As I've talked about previously,[1] these numbers are all volatile for a variety of reasons, some Ebola-specific, so regard this chart for its trends only.
  • I am only able to plot what is publicly available. To date, this does not include granular data with dates of onset, or daily data of any kind. The WHO have these data and you will see them become more available through their Situation Reports found here http://www.who.int/csr/disease/ebola/situation-reports/en/

References... 
  1. Ebola virus disease and lab testing...
    http://virologydownunder.blogspot.com.au/2014/04/ebola-virus-disease-and-lab-testing.html
  2. Ebolavirus outbreak Situation Reports
     http://www.who.int/csr/disease/ebola/situation-reports/en/

Thursday, July 3, 2014

Ebola Virus Disease (EVD) 2014 West African outbreak..

A new static page on which I will update the 2014 West African Ebola virus disease (EVD) outbreak numbers after they are released by the World Health Organisation (WHO).

The WHO have commenced creating multi-page Situation Reports.[2] They contain more granular data than is publicly available. They will be reported at least once per week.

If I become impatient, I'll cobble together the individual country's numbers via reliefweb.int, then update that once WHO data are available (which may result in a drop in totals as WHO numbers may have been collected a littler earlier).

Latest data taken from: http://apps.who.int/iris/bitstream/10665/135029/1/roadmapupdate26sept14_eng.pdf?ua=1
Date of DON: 26-Sept
Dates covered: 23-Sept


A note about the proportion of fatal cases (PFC): 
On these graphs, my PFC calculations for West African countries and the DRC are based on dividing the total number of suspect/probable/confirmed deaths by the number of total suspect/probable/confirmed cases for the same date. This is crude and may be a sizable underestimate of the true PFC.

It may be better to use the deaths at the most recent date divided by the total cases from 9-14-days  earlier (this number is not precisely known) to better account for the lag in time between presenting to a treatment facility and dying (for those who do not recover). 

Some estimates suggest the true PFC may be closer to 80%. I don't have enough data (or smarts) to be able to calculate that for now so please be aware the PFC above is likely an underestimate.


Reminders:

  • The chart above, as with all on VDU, is made for general interest only. It is also freely available for anyone's use, just cite the page and me please. It may be that I have misinterpreted the language in the reports (sometimes a little tricky to wade through) or miscalculated some totals based on the way data have been presented. 
  • Sometimes there are very country-specific differences in what gets presented to/via the World WHO DONs/SitReps which make this process less clear than it could be. I recommend you have a read and compare the data from each of the countries for yourself to understand these issues. 
  • As I've talked about previously,[1] these numbers are all volatile for a variety of reasons, some Ebola-specific, so regard this chart for its trends only.
  • I am only able to plot what is publicly available. To date, this does not include granular data with dates of onset, or daily data of any kind. The WHO have these data and you will see them become more available through their Situation Reports found here http://www.who.int/csr/disease/ebola/situation-reports/en/
References...

Wednesday, July 2, 2014

Ebola Virus Disease (EVD) West Africa update for 1-July-2014... [UPDATED]

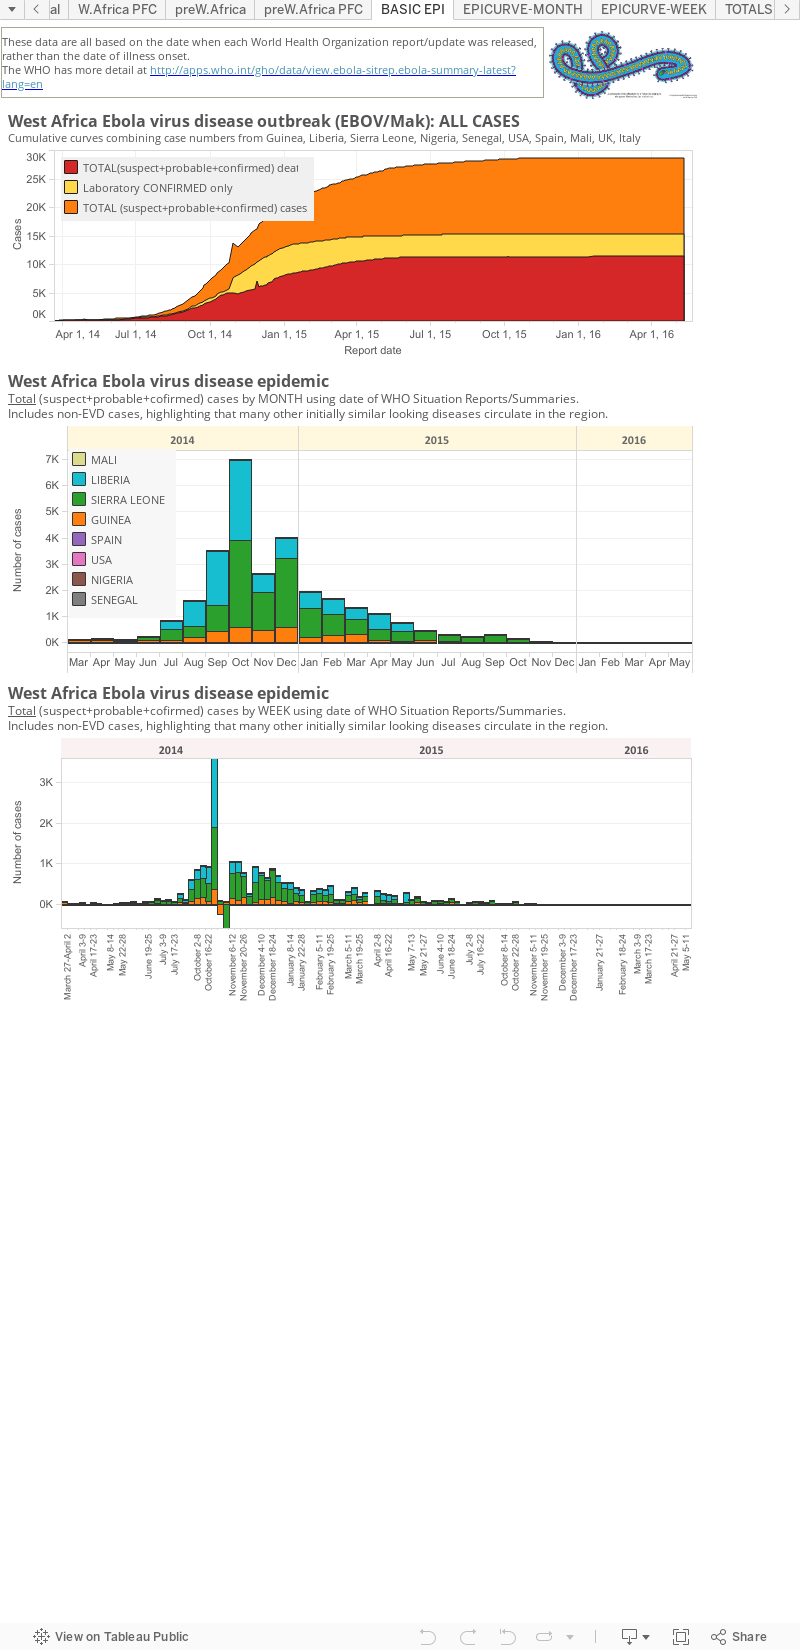
Some quick visualizations of the Zaire ebolavirus outbreak data based, as previously,[1] on the World Health Organization's publicly available data.

The presentation below is made using Tableau, a new platform for me so please let me know of anything that has failed, numbers that are wrong, something that's translated / formatted badly on your device...whatever. Tableau certainly allows for much faster updating of charts...once you've put a leash on it anyway.

PLEASE NOTE: I now have these same data on a static page (one with a webpage address that does not change with each updated blog).
Please vist the links below for the latest EVD numbers and maps.


References...
  1. Ebola virus disease (EVD) West Africa update for 24-June, WHO-AFRO update...
    http://virologydownunder.blogspot.com.au/2014/06/ebola-virus-disease-evd-west-africa_25.html
  2. Ebola virus disease, West Africa – update | Disease outbreak news | 1 July 2014
    http://www.who.int/csr/don/2014_07_01_ebola/en/
  3. Ebola virus disease and lab testing...
    http://virologydownunder.blogspot.com.au/2014/04/ebola-virus-disease-and-lab-testing.html

Wednesday, June 25, 2014

Ebola virus disease (EVD) West Africa: 24-June WHO-AFRO update...

Apart from something unexplained going on with the wording &/or numbers in the Sierra Leone portion of the report, the latest Disease Outbreak News (DON) from the World Health Organization (WHO) reports a continuing climb in the case numbers, particularly those from Sierra Leone.

The cumulative totals of suspected/probable/ fatal EVD cases, just fatal cases and the numbers confirmed by laboratory analysis. Latest data are based on WHO DON.[1] Lines use the numbers on the vertical axis on the left, bars use the right hand axis. The percentages are the proportion of fatal cases at the time point indicated.
Click on chart to enlarge.


The country-based EVD cumulative totals. Latest data are based on WHO DONs (see latest, [1]). Lines use the numbers on the vertical axis on the left. The percentages are the proportion of fatal cases at the time point indicated.
Click on image to enlarge

A reminder:
The chart above, as with all on VDU, is made for general interest only. It is also freely available for anyone's use, just cite the page and me please. It may be that I have misinterpreted the language in the reports (sometimes a little tricky to wade through) or miscalculated some totals based on the way data have been presented. 
There are very country-specific differences in what gets presented to/via the World Health Organization's Disease Outbreak News which make this process less clear than it could be. I recommend you have a read and compare the data from each of the 3 countries for yourself to understand these issues. 
As I've talked about previously,[2] these numbers are all volatile for a variety of reasons, some Ebola-specific, so regard this chart for its trends only.

References...
  1. Ebola virus disease, West Africa - update
    http://www.who.int/csr/don/2014_06_24_ebola/en/
  2. Ebola virus disease and lab testing...
    http://virologydownunder.blogspot.com.au/2014/04/ebola-virus-disease-and-lab-testing.html

Monday, June 23, 2014

Ebola virus disease (EVD) West Africa update for 22-June, WHO-AFRO update...

[CHECK OUT TAB ALONG TOP FOR LATEST EBOLA NUMBERS]

A new Disease Outbreak News has appeared. It shows that cases have risen by ~39 since the last report.

Total suspected/probable/confirmed cases: 567
Total suspected/probable/confirmed deaths: 350 (61.7%)
Total lab confirmations: 385 (67.9% of 567)


The cumulative totals of suspected/probable/ fatal EVD cases, just fatal cases and the numbers confirmed by laboratory analysis. Data are based on WHO DONs. Lines use the numbers on the vertical axis on the left, bars use the right hand axis. The percentages are the proportion of fatal cases at the time point indicated.
Click on chart to enlarge.
Reported cases continue to rise most rapidly in in Sierra Leone as we can see from the country-specific chart below..


The country-based EVD cumulative totals. Data are based on WHO DONs (see latest, [1]). Lines use the numbers on the vertical axis on the left. The percentages are the proportion of fatal cases at the time point indicated.
Click on image to enlarge.

A reminder:
The chart above, as with all on VDU, is made for general interest only. It is also freely available for anyone's use, just cite the page and me please. It may be that I have misinterpreted the language in the reports (sometimes a little tricky to wade through) or miscalculated some totals based on the way data have been presented. 
There are very country-specific differences in what gets presented to/via the World Health Organization's Disease Outbreak News which make this process less clear than it could be. I recommend you have a read and compare the data from each of the 3 countries for yourself to understand these issues. 
As I've talked about previously,[2] these numbers are all volatile for a variety of reasons, some Ebola-specific, so regard this chart for its trends only.

References...
  1. Ebola virus disease, West Africa - update (awaiting move out of the Latest News section)
    http://www.who.int/csr/don/2014_06_22_ebola/en/
  2. Ebola virus disease and lab testing...
    http://virologydownunder.blogspot.com.au/2014/04/ebola-virus-disease-and-lab-testing.html

Thursday, June 19, 2014

Ebola Virus Disease: Country contributors in 2014 West African outbreak...

Data are based on WHO DONs (see latest, [1]). Lines use the numbers on the vertical  axis on the left. The percentages are the proportion of fatal cases at the time point indicated.
Click on image to enlarge.

As the Ebola Virus Disease (EVD) outbreak in West Africa continues [1], and grows larger, I thought it worth looking at which countries have contributed cases lately. 

  • In late May, Guinea started to see a new, and since then steady, ascension in the number of suspected / probable / confirmed cases and and deaths. 
  • In early June, a big jump occurred in Sierra Leone. 
  • In Liberia there was a rise not in cases, but in fatalities; for a while Liberia had an unusually low proportion of fatal cases (PFC), at just 8%, then something happened to the numbers and it climbed to the higher proportion we expect from Ebola virus.

As I noted last night,[2] and Maia Majumder has also noted on her blog [3] and via a very nice story by the Toronto Star's Jennifer Yang,[4] the PFC for this outbreak is lower than that seen in a number of previous EVD outbreaks (see last night's post for related charts from me [2]). In fact it has been lower than that from other outbreaks at all preceding data points in 2014. Of course this lower PFC, still sitting at a horrible 64%, may just be an artefact of the outbreak not being over yet, and the dust probably still being in the air and yet to settle. 

The PFC may rise as more information is gathered and testing completed, post-outbreak. It it may also be that due to the quick deployment of experts in healthcare, education and laboratory analysis, and perhaps new or different supportive methods, that this outbreak is not taking as many lives as previous outbreak have. But I can't speak authoritatively on any of that.

A reminder:
The chart above, as with all on VDU, is made for general interest only. It is also freely available for anyone's use, just cite the page and me please. It may be that I have misinterpreted the language in the reports (sometimes a little tricky to wade through) or miscalculated some totals based on the way data have been presented. 
There are very country-specific differences in what gets presented to/via the World Health Organization's Disease Outbreak News which make this process less clear than it could be. I recommend you have a read and compare the data from each of the 3 countries for yourself to understand these issues. 
As I've talked about previously,[5] these numbers are all volatile for a variety of reasons, some Ebola-specific, so regard this chart for its trends only.

References...

  1. Ebola virus disease, West Africa – update | 18-June-2014
    http://www.who.int/csr/don/2014_06_18_ebola/en/
  2. West African Ebola virus disease (EVD) outbreak flares up in late May and in early June...
    http://virologydownunder.blogspot.com.au/2014/06/west-african-ebola-virus-disease-evd.html
  3. Ebola 2014: Fatality & Lab-Confirmation Charts
    http://maimunamajumder.wordpress.com/2014/06/19/ebola-2014-fatality-lab-confirmation-charts/
  4. The Ebola outbreak that refuses to die
    http://www.thestar.com/news/the_world_daily/2014/06/the_ebola_outbreak_that_refuses_to_die.html
  5. Ebola virus disease and lab testing...http://virologydownunder.blogspot.com.au/2014/04/ebola-virus-disease-and-lab-testing.html