Wednesday, August 13, 2014

Behind the naming of ebolaviruses...

Just don't call me a taxi
Virus taxonomy is the classification of viruses into groups based on similarities. 

Today classification is supported by viral gene and genome sequence information.

The International Committee on Taxonomy of Viruses (ICTV) takes care of the official virus taxonomy. It has a pretty friendly website with a good search engine and the latest (2013 at writing) virus taxonomy can be found here. [1]

So what does it, and its tome, Virus Taxonomy, Ninth Report of the International Committee on Taxonomy of Viruses [2], have to say about ebolaviruses? Well, not as much as you might like, if you want to be able to name them, talk conversationally about them and discuss the issues around the disease resulting from infection by most of them. Sure, you can just call it all "Ebola" (which is a river in Africa by the way) and be done with it, but you'd be wrong. And some smart alec will correct you for sure. Here is where the ICTV Filoviridae Study Group fills in a lot of blanks.

One thing to get on top of first up. When talking or writing about these    looking little pathogens, we can just call lump them together under the conversational term "ebolaviruses" thus..."Hey Jeanette, did you hear about the latest ebolavirus infection numbers over the weekend?" is a question that could refer to any of the 5 very different viruses.

So, let's try and make that tearoom conversation a little more accurate.

The very dry detailed stuff down to the level of a species.

The italicization and the capitalization below are really important to taxonomy guys - so, ya know, care. 

Also, the ICTV reminds us that the name of the species is not the name of a virus - they are 2 different things. The species is a broad term for all the measurably different viruses out in the wild, that it contains. Here, species is to viruses what Mitsubishi Sigma is to identifying my old car. A virus name,

e.g. Ebola virus (see below), is like identifying my car as "a silver 1988 Mitsubishi Sigma". 

What if we used taxonomy on cars? A different way to explain how to name ebolaviruses.
Click to enlarge


The viruses we are talking about here belong to the order Mononegavirales, family Filoviridae, genus Ebolavirus. 

There are 5 species within the genus. The species names are in italics below. Underneath is the name of the virus (the virus belongs to the species container) and its abbreviation. The viruses in bold have caused outbreaks of human disease.
  • Taï Forest ebolavirus
    • Taï Forest virus (TAFV)
  • Reston ebolavirus
    • Reston virus (RESTV)
  • Sudan ebolavirus
    • Sudan virus (SUDV)
  • Zaire ebolavirus
    • Ebola virus (EBOV)
  • Bundibugyo ebolavirus
    • Bundibugyo virus (BDBV)

But what should I call the latest ebolavirus strain, variant, genotype, subtype, serotype, isolate thingy?

In the case of the current outbreak, that latest virus is an Ebola virus (EBOV), which we can now say belongs to the species Zaire ebolavirus (a Mitsubishi Sigma). 

But back to the car analogy. The silver 1989 Mitsubishi Sigma name is still not enough to tell it apart from any other silver Mitsubishi Sigma parked at the same shopping centre. How do you choose yours in a way that won't get you arrested for breaking into someone else's car? They both look like silver Mitsubishi Sigmas. But the silver Mitsubishi Sigma with license plate ABC 321 is yours and your alone, and that code differentiates your car from any other anywhere in the world.

We know from genome sequencing studies that the virus circulating in Guinea is an EBOV (a silver Mitsubishi Sigma) and is not identical to the one in (what was called) Zaire in 1976 (this silver Mitsubishi Sigma car has a different license plate). They couldn't be the same physical virus anyway, because each person hosts millions and millions of virions, each cell has a varied population of viruses in it, and each virion has a relatively short life. 

There is no universal definition for classification of viruses below the level of a species. But there are lots of terms that are used - most are listed in the heading to this section. In filovirus-land, the Study Group has sought to impart some order upon the chaos [3]. 

A virus strain needs to have 1 or more observable, genetically stable and unique differences compared to other viruses in the same species. For instance, one might cause a disease that is different from the one we know. So apart from a different license plate, it might also have an Awesome Mix #1 CD in the tray. 

A variant has some genetic sequence or other differences that may result in a slightly different observable change. As far as we can tell from the >100 near-complete genome sequences online now, the West African EBOV is a variant and not a strain of Zaire ebolavirus. For example, these from Guinea and Sierra Leone (ManoRiver variants from samples collected in June 2014)


A virus isolate is a virus sample resulting from growing or culturing it in cells or tissues. Variants can therefore be represented by isolates. These isolates can be identical or slightly different (your neighbour could order the exact same car as you did-but he would still have a different license plate and no bobble-heads and fluffy dice).

The naming schemes do go into further detail, but you can read that in [3].

The disease.

The disease caused by EBOV, SUDV, TAFV and BDBV is called Ebola virus disease (EVD). Frankly, that is a tough one to explain after all of the above. It reads as though we are talking about just 1 virus causing disease (EBOV). But not so. Viruses from 4 species cause EVD - EBOV, SUDV, TAFV and BDBV. Diseases are named by World Health Organization's International Classification of Diseases (ICD) site, (4) and the name of this disease goes back many years and has not been updated yet. The disease has been called Ebola haemorrhagic fever, but is not now. And to continue from the taxonomy above, EVD is caused by a virus that can be ascribed to a species. In West Africa right now, EVD is due to infection by an Ebola virus variant classified in the species  Zaire ebolavirus.

Navigating a tree in the ebolavirus jungle.

Lastly, I've cobbled together a tree of genomes from each of the 5 ebolavirus species. It may help. Or not.


A phylogenetic tree of some genome sequences of the 5 species of ebolavirus, each indicated with a specific coloured dot.


References...
  1. ICTV Virus Taxonomy: 2013 Release
    http://www.ictvonline.org/virusTaxonomy.asp
  2. Ebola virus disease World Helath Organization fact sheet
    http://www.who.int/mediacentre/factsheets/fs103/en/
  3. Virus nomenclature below the species level: a standardized nomenclature for natural variants of viruses assigned to the family Filoviridae.Arch Virol (2013) 158:301–311.
    http://download.springer.com/static/pdf/619/art%253A10.1007%252Fs00705-012-1454-0.pdf?auth66=1408093824_af9d701ab93574066469a6f6745c11d7&ext=.pdf
  4. International Classification of Diseases (ICD)
    http://www.who.int/classifications/icd/en/

Saturday, August 9, 2014

How to read a VDU graph...

I'm a pretty simple guy. So the stuff that I put onto Virology Down Under's (VDU) blog is usually something I think can be understood by you - my yard stick is that if I can understand it, then I think you can. Sometimes it can get pretty technical though and with things always done in a rush, I don't stop and explain as much as I could. Which is why I value feedback. And I've had some good stuff from @DeclanButlerNat, @JorgeCastillaE and @Moro_Cedric this week. 

Different levels of experience read this blog and my posts on Twitter, so sometimes I direct my graphs towards them. But I do understand that we scientists can be easily carried away by our interests and forget that we're quite used to interpreting our own presentation styles in a certain and speedy way. We've had lots of experience doing it that way. I can change a tyre (as I was reminded a couple of nights ago, at midnight) but I couldn't fix my engine.

At the heart of reading a graph is this fact: you have to look at the axes to understand what the lines or bars or areas mean. Once you know the style, you can understand it at a glance - but first time, examine it with care. If it's one of mine, feel free to ask me what I'm trying to show if it is not immediately obvious. I very well may have failed to make it clear.

So this is a little overview of how to read some of the graphs which I use to communicate what I consider to be otherwise yawn-inducing tables of numbers about viral infection and disease numbers.

A picture is worth a thousand words..

This is a good thing because with my lack of typing skills, if I had to type 1,000 word all the time, that would be at least 200 typos. Graphs plot those tabular numbers in a more colourful and visual way. Once you know how to read a graph, they can become powerful and quick ways to get a quick update on the state of play. On VDU the game seems to be about outbreak data. That's just the way things have evolved for me since I first blogged on 28-March 2013. This includes graphing the number of people with disease (cases), changes in the number of cases, numbers that are suspected versus the number that are actually laboratory confirmed (my currency), dates of onset illness (favoured piece of data and the hardest to come by publicly), the numbers who die, the proportion (%) of all cases/detections who die, dates when disease was reported, sex, age and all of that can be plotted on graphs by day, week, month or year.

Interpreting a basic graph on VDU...

The graph below (Graph 1) comes from following Middle East respiratory syndrome (MERS) public data. It shows the key parts of the structure of the graphs - the axes (the horizontal and vertical lines that are the key to reading the plotted numbers) and the axes.

  • A basic graph has a bottom horizontal line called the x-axis and it has a vertical line on the side called the y-axis. These are used to tell you what the numbers plotted on the graph mean; they are a key to the placement of each point on a graph, according to at least 2 different values.
  • Each point on a graph represents a coordinate. Its made up of an x-axis values (abscissa) and a y-axis value (ordinate). For example we plot 50 cases reported on Thursday or 50 on the y-axis and Thursday one the x-axis (x,y)
  • The points that we plot as pairs of x and y data can be joined up and shown as a line (the area underneath the line can also be coloured in which looks like a mountain that may have peaks and troughs) or they can be plotted as bars. There are other ways too - but I keep it simple. Joining up these dots is not always accurate - we may have no idea what is really happening to the numbers between any 2 points, in that case a bar graph may be more realistic as it shows the numbers at a distinct point in time. Sometimes bar graphs don't work from a formatting perspective (eg bars get so skinny you can't see them). Other times, joining the dots reveals the trends (the general direction that events are heading even if we don't know the values). Trends are useful in infectious disease as they show what has happened and what the latest data mean in the context of what has come before - so not too unrealistic. Some of this is about being accurate while not being too overly obsessive.

The particular example graph I've included below (Graph 1)  is a little trickier than some because it has 2 y-axes (vertical lines) - a primary (left-hand side) and a secondary (right-hand side). Some of the numbers are plotted against the primary y-axis (left vertical line) and some against the secondary y-axis (the right hand vertical line). This lets me "double-dip" on shared x-axis numbers, in this case, dates. I'm graphing the course of 2 different things (number of actual cases by day of illness onset) and the number of reported detected by date. These are 2 different things that have dates in common. 

This graph lets us compare, using the same x-axis, what the MERS case numbers look like when they are plotted by the day the people were reported to have become ill compared to the date of public reporting of the cases. There are differences that become more clear when you can run the 2 lines on the same graph, that may be a bit harder to see when they are plotted on 2 separate graphs. This graph highlights that when cases become ill and when they are reported are different things. It also shows that there were a bunch of cases (113) reported in 1 day that have never been given dates of illness onset (or hospitalization or the date they were each reported to the Ministry of Health). It also makes use of the 2 y-axes to have different scales. The primary or left-hand y-axis goes up to 35 while the secondary or right-hand y-axis maxes out at 120. If the same axis values were used, the illness onset cases would mostly be hard to see.


Graph 1. The basics of a graph.
What about cumulative graphs? What are they and how do I interpret those?

The next graph is made to show cases piling up over time (Graph 2). This is the graph that sparked this blog. It plots numbers as a line graph but instead of showing the value at that timepoint (day, week, month, year), it adds the new number to sum of all the previous numbers. It is plotting a cumulative tally, so it will always be a hill with an upwards (left-to-right, bottom to top) slope except when there are no new cases to add, when the curve becomes parallel to the x-axis - a flat line. How steep that line is can tells us how rapidly cases are piling up. That can also be fudged if you present the chart with a very short or long x-axis.

  • In the case of the Zaire ebolavirus outbreak in West Africa, we have the unusual ability to compare numbers from multiple countries at the same time, and use the same x-axis. Here, we show the date when the World Health Organization's Disease Outbreak News update was released. Sadly for us graph addicts, this doesn't include any illness onset dates, but the WHO do have those data and plot it themselves here (1).
  • A steep slope indicates a rapid rise in cases and this results from a lot of new cases being added in a short period of time.
  • A near flat or horizontal slope to the line shows that there are not many new cases being added. 
  • In this graph we also show multiple lines plotted using the primary (left) x-axis to present how much and at what rate the total suspect, probable and laboratory confirmed case numbers are piling up (pink) as well as how the deaths from among that number are changing (blue line) and how many of the cases are being laboratory confirmed (green line) as due to the virus suspected of being the cause. This last one is important as it gives a glimpse of how the laboratory network is coping, perhaps how specimen access is going and how much faith to put in the other two totals. Why are we worried about the result totals? Because many other things can look like Ebola virus disease (EVD) early on, and even later in the disease course. A laboratory test is the only way to be certain that the patient had that virus.
  • Nigeria's numbers look to be rising alarmingly fast. Relative to each other they are, but compared to the dozens of new EVD cases being added between reports in other countries, it is still a small (although still very bad for Nigeria!) increase. This highlights that care is needed when reading charts. Perhaps also an understanding that between different outbreaks, the rate of new cases being added is disease specific. Lots of influenzavirus detections during flu season is what we expect, any ebolavirus cases are not what we expect nor what we want to see. Context. A hard thing to account for and probably a matter of experience.
Graph 2. The cumulative case graph. Adding new numbers to the sum of all the numbers that came before. 
Click on image to enlarge.

Graph 3. Changing the scale. Raising the primary y-axis (left) scale to 750, the level of the other country graphs, makes Nigeria's case numbers look tiny. But it underestimates the impact of the localised spread of Zaire ebolavirus in an are that was not part of the outbreak until a case flew in and spread it. Changing the scale is not just whimsical decision making, it can highlight the importance of events that may otherwise go unnoticed.
Click on image to enlarge.

Take care when interpreting a graph - look at the axes and also use your noodle

Finally, I'm going to look at the way in which I present the numbers I plot on a graph. I'm using the cumulative case chart for Liberia as my example (Graph 4 collection). Its the same one used in Graph 3 - the only thing different is that I've dragged the x-axis to the left (shrunk) or to the right (stretched) to see what that does. 
  • The line plots look more or less steep when you shrink or stretch the x-axis, respectively. But the numbers have not changed. Possibly, our interpretation of them has, as a result of seeing the slope change. Remember though, check the axes. If you look at the x-axis, the shrunken version shows that those cases have climbed over a longer period than the slope suggests. Always check the denominator (the y of x/y) when you think about slope. Equally, the flatter curves of the stretched out x-axis, at the bottom of the Graph 4 collection, have to be looked at in context with time. The dates have been dragged out to what may be an unreasonable length, which makes the slopes look less; but they are still steeper in July than they were in April. Look around the graph for comparison. 
  • As I said above, the current multi-country outbreak lets us compare and so we can see that some areas are adding new cases very rapidly between each report (Liberia and Sierra Leone) while others (Guinea) are not adding as many as quickly. Nigeria looks to have jumped quickly but that is also because of the altered scale (discussed above) 
  • On VDU I get around this by also adding charts that plot total numbers per day or week or month or year. This shows a more discrete series of data that grow or shrink as the outbreak peaks or resolves. The 2 peaks of influenza A(H7N9) virus outbreaks illustrate this nicely - especially when combined with a cumulative case chart (Graph 5)!
  • There is no real right or wrong here (although there are pixel width constraints)- but don't let your perceptions fool you when looking at someone's graphs for the first time. Take some time to really look at the graphs.
Graph 4 collection. Stretching the x-axis can seem like stretching the truth. But carefully read the axes. Some experience is needed here and ultimately you are at the mercy of the person presenting the data.
Click on image to enlarge.


Graph 5. Influenza A(H7N9) virus outbreak in China during 2013 and 2014. Plotting the numbers discretely (by week) clearly shows the two outbreak peaks (darker blue lines joining the data point dots) and gives valuable context to the cumulative graph in the background (pale blue mountain). This is probably my favourite style of disease numbers graph.
Click on image to enlarge.
I hope that has helped make sense of my graphs, and perhaps those of others too. I'm always on Twitter so hit me up with questions about this or requests for more posts like this, or to tell me whether it was helpful.

References

  1. http://www.who.int/csr/disease/ebola/EVD_WestAfrica_WHO_RiskAssessment_20140624.pdf?ua=1


Thursday, August 7, 2014

It is perfectly okay to be a bit freaked out by the Zaire ebolavirus...

The Zaire ebolavirus (abbreviated as EBOV) is one of 5 species of ebolavirus and a member of the same viral family as the species Marburg marburgvirus (yeah, I know). Three of the ebolaviruses, EBOV, Bundibugyo ebolavirus (BDBV) and Sudan ebolavirus (SUDV) are associated with Ebola virus disease (EVD) while Reston ebolavirus (RESTV) and Tai Forest ebolavirus (TAFV) are not.

Much has been written this week on why you are perfectly safe from an outbreak of EVD in your (judging by VDU's stats) probably non-West African home town, or while at the fruit shop or on your couch watching the trailer for Guardians of the Galaxy on endless loop while clutching your ticket for tomorrow night (it's reeeal). 

A plane may deliver an infected person to your country, but our healthcare system will catch it. It will be contained, kept in its box like a hyperactive yet frustrated boggart. Nothing to see here. Move along please. These assurances come after the preceding week in which we felt the aftermath of the first symptomatic "EVD on a plane" incident, 2 US healthcare workers becoming infected and the death of a very bright light in the treatment of EVD patients in Sierra Leone. Twitter's ebola hashtag has been afire like a stock exchange ticker ever since 2-weeks ago.

I'm here to say, it's okay to freak out as much as you like...just don't run into traffic, sell the kids or move to an isolated farm and stock up on tinned food. It's not that kinda bat-crazy. (apt)

So what is it about EVD that could warrant you feeling more fearful about it than about other fatal infections that are far more common? 

Don't forget >14,000 deaths due to Clostridium difficile infections per year (1), 200,000 people die of cholera each year (2), >600,000 died of malaria in 2012 (3) and >1,000,000 died from an AIDS-related illness in 2012 (4). Big numbers. How does our fear remain in the face of that tide of microbial mortality?

Could our unreasonable fears be due to any of these?:

  • Most diseases on that list are (still) treatable. HIV not so much, and antimicrobial resistance is of course on the rapid rise. Yet EVD kills more than 1 person in 2 and it does so quickly. That's scary. It isn't treatable; although that could be changing if the ZMapp "plantibody" and its pipeline comrades ever get to decent controlled trials.
  • Perhaps you just don't fee like you will get cholera or AIDS. They are "somebody else" problems but this jungle virus, well that's all over the TV, the papers, the web and on radio. It must be spreading fast.
  • This outbreak has spread widely in 3 countries, and cases are being added in numbers above 100 every few days. Now EVD seems to be spreading from that person who travelled on a plane while ill. Healthcare worker contacts seem to be bearing the brunt in this 4th country (Nigeria). OH, and he vomited on one of the planes he took on his multi-stop journey from Liberia to Nigeria.
  • EVD is a haemorrhagic fever. Haemorrhagic fever I said - arrggh!! No wonder they changed that name! It just sounds scary.
  • Around 40% of cases show obvious signs of bleeding. Not the movie level, leaking-like-a-sieve stuff though. But someone is bleeding. On the outside. For everyone to see. From a virus infection. 
  • EVD starts off like the flu, or the effects of a dodgy curry but it can end up with you laid out, alone and dying, with only your suited carers for close yet distant comfort.
  • Entire families get wiped out during these outbreaks. Perhaps not scary, but heart wrenchingly tragic and something we can feel in our own guts.
  • Even experienced healthcare workers get infected by this virus. Sure, this is likely attributable to the hot, overwhelming conditions, to the numbers of cases, under-resourced clinics (by big shiny HEPA-filter equipped hospital standards anyway), tiredness and accidents, but it's happening.
  • Just because! Humans watch in fascination the most exotic and scary things. Many like to be scared.

So I think it's okay and even perfectly normal to feel uncomfortable, worried, fearful, perhaps even a bit angry that your country is not doing more to help in West Africa, or is doing so a bit late.

Don't add guilt about having those feelings. 

But do make sure you reality check yourself and your friends.

Some of the concerns listed above just won't be a problem for you in your neck of the woods. Most of us were probably born into a very different situation to those being ravaged by the Zaire ebolavirus variant, a virus about which little was known by those who live in the region, until very recently. Perhaps that is partly our fault since we have lately been able to show that ebolaviruses are not new there after all (5). But this multi-country outbreak is likely to have started through practices that have been commonplace yet not ever resulted in this sort of death before. Most who will read this do so from a place of relative privilege. You are not likely to see an EVD case in your life. Do what you can to find out the facts. WHO and the CDC have many great webpages of resources that can help teach the realities. Read them. 

One reality is very clear, West Africa needs help to shut this down. It should have had it sooner.

Fear is fine, but remember your reality.

References..

  1. http://blogs.scientificamerican.com/molecules-to-medicine/2014/08/05/ebola-and-priorities-in-drug-development/ (from http://blogs.scientificamerican.com/molecules-to-medicine/2014/08/05/ebola-and-priorities-in-drug-development/) 
  2. http://www.who.int/mediacentre/factsheets/fs107/en/
  3. http://www.who.int/mediacentre/factsheets/fs094/en/
  4. http://www.who.int/gho/hiv/en/
  5. http://wwwnc.cdc.gov/eid/article/20/7/13-1265_article

Tuesday, August 5, 2014

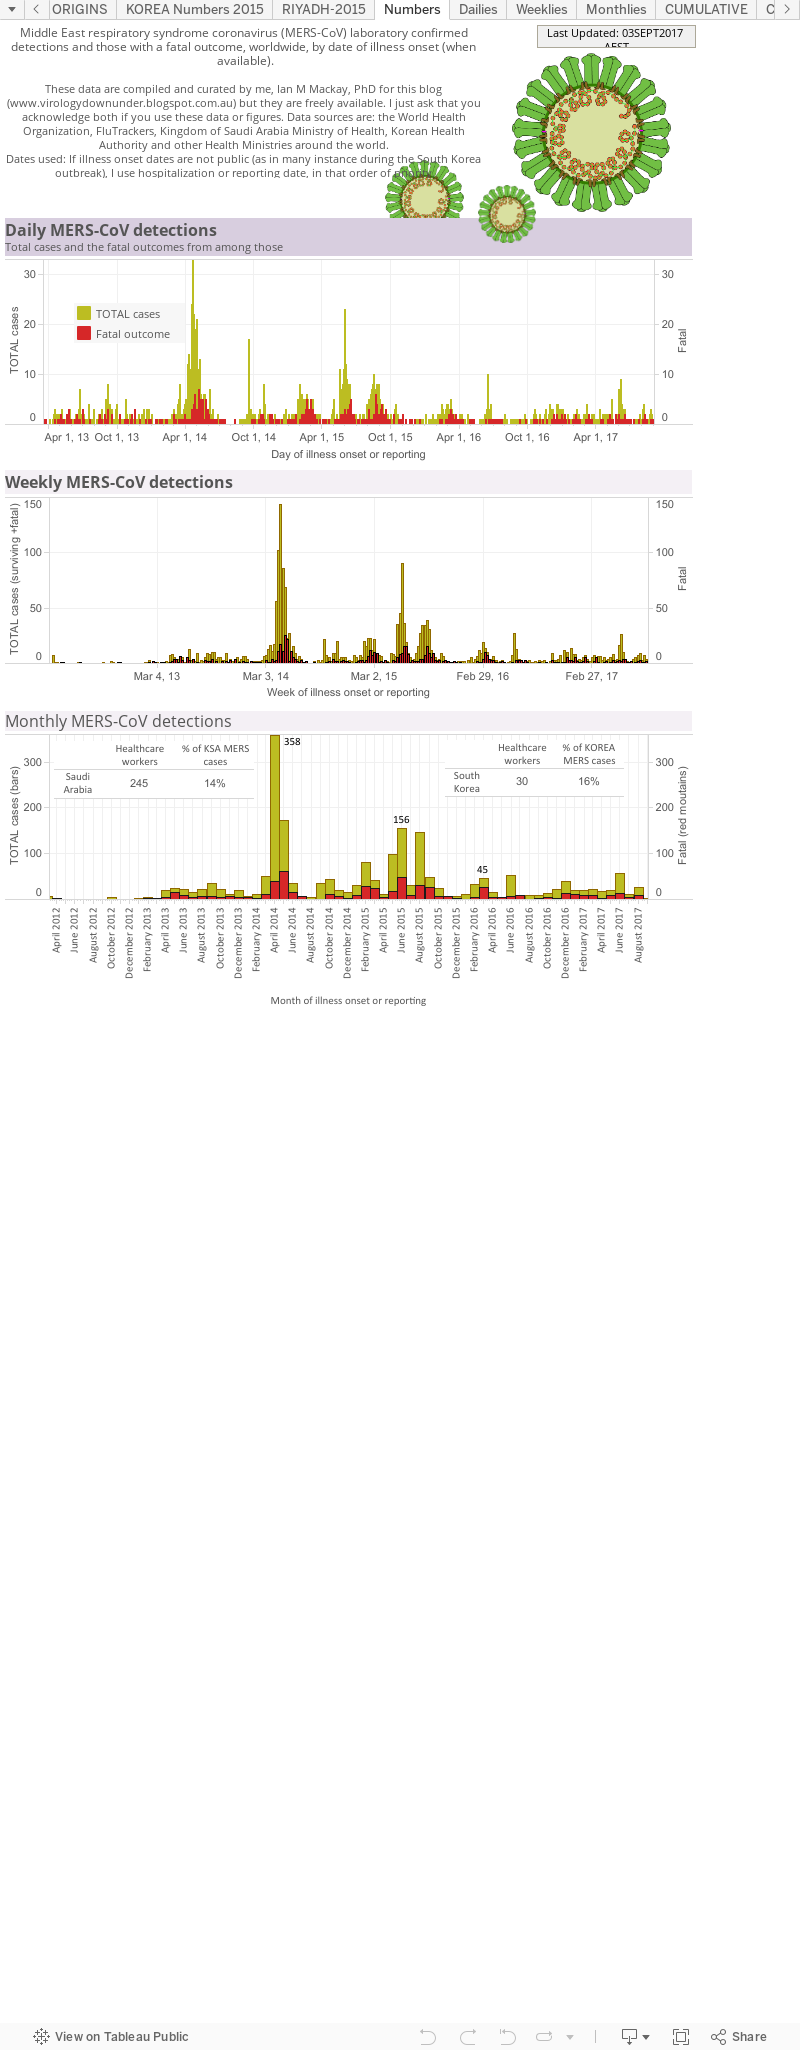
MERS-CoV daily, monthly and cumulative numbers over time...

This is a static page - the internet address won't change, just the charts as new numbers are added. The page will follow Middle East respiratory syndrome coronavirus (MERS-CoV) detections by day, month and the cumulative tallies, worldwide.


Data are derived from the World Health Organization, FluTrackers and various Ministries of Health.
The chart above, as with all on VDU, is made for general interest only. It is also freely available for anyone's use, just cite the page and me please. 

Thursday, July 31, 2014

Virus variability, dopey data and insufficient infection control do not support the theory that bioterrorism is behind the ongoing MERS-CoV outbreak.

A collaborative note from (alphabetically): @influenza_bio, @MackayIM, @maiamajumder, @neva925, @stgoldst, @kat_arden

In an unusual twist to the ever-entertaining Middle East respiratory syndrome coronavirus (MERS-CoV) narrative, a new study has been published(1,2) that calls upon us to consider seriously, or at least acknowledge, the possibility that bioterrorism explains the emergence of this virus as a rare but often deadly human pathogen. Dr Raina MacIntyre (@RainaMacIntyre) of the University of New South Wales suggests that "deliberate release" may explain the allegedly paradoxical pattern of ongoing MERS-CoV infections in Saudi Arabia. She concluded this after comparing MERS-CoV numbers to the 2003 epidemic of severe acute respiratory syndrome coronavirus (SARS-CoV).(3) Apparently, the elephant in the room that we may all be overlooking is the possibility that the virus is being or has been released deliberately in repeated acts of bioterrorism.

“Bioterrorism” is inherently an evocative and emotive word; it has the ability to elicit the sort of worry and fear among the wider community generated by the likes of “Ebola” and “deadly airborne virus”. It also feeds conspiracy theories.

In our collective opinion, bioterrorism, with respect to MERS-CoV and otherwise, should not be invoked without at least some preliminary data that point specifically to a deliberate human cause. 

We would like to make it clear that we don't object to considering bioterrorism as a potential cause of the emergence of MERS-CoV. It is always worth considering whether an outbreak of any human, animal or plant disease is due to deliberate human activity. Thankfully, there are people whose jobs are to do just that. 

However, we have some concerns about the rationale put forth in Dr. MacIntyre's paper regarding why bioterrorism may explain sporadic MERS-CoV infections better than nature and would like to highlight some notable factual errors and omissions that might have influenced her conclusions. No data are available that could decisively rule out the possibility of bioterrorism as the cause of the ongoing MERS-CoV outbreak, as one cannot prove a negative. Nonetheless, we believe that Dr. MacIntyre's arguments are flawed and that the available evidence cannot be used to support her theory. Substantial scientific and methodological problems exist in Dr MacIntyre’s paper that undermine her deliberate release theory. Here, we discuss some of these issues, and we offer perspective on why bioterrorism is unlikely to be a cause of human or animal MERS-CoV infections.

MERS is different to SARS. Yep. We already knew that.

A substantial amount of Dr MacIntyre’s report is based on comparing MERS to SARS.(4) MERS-CoV and SARS-CoV are genetically, taxonomically and phylogenetically divergent, and MERS and SARS are immunobiologically, clinically and pathologically distinct. Furthermore, their transmissibility in humans, their environmental contexts, their animal hosts and the interactions between their animal hosts and humans are different. Thus, the comparison between the two viruses must, a priori, result in finding MERS and SARS outbreaks to be characteristically different. That SARS and MERS are different has also been stated previously.(5,6) Compared to SARS, MERS generally progresses more rapidly and occurs more frequently in individuals with pre-existing medical conditions, including diabetes, chronic lung disease, renal failure and in people who are immunocompromised. Moreover, MERS-CoV exhibits a broader tissue tropism and induces faster cellular damage than SARS-CoV; it also employs a completely different receptor and prompts a comparatively delayed cellular immune response. These two viruses belong to separate lineages within the genus Betacoronavirus; they are chalk and cheese.

Moreover, from an epidemiological viewpoint, it is extremely important to note that human cases of infection with these two viruses have never geographically overlapped. This is no small fact. The population of Saudi Arabia seems to have an unusually high proportion of older males (Fig 1) with pre-existing medical conditions; from the data that are currently available, this particular group also appears to be most vulnerable to fatal outcomes. Outside this population, MERS-CoV infections seem to be far less frequently associated with severe disease and death.
 
Figure 1. Older males represent a greater proportion of MERS cases and even more of the deaths attributed to infection with MERS-CoV.

Perhaps most salient to this discussion is that MERS-CoV does not transmit in humans as well as SARS-CoV did. In fact, MERS-CoV transmits quite poorly between humans unless a perfect storm of pre-existing medical conditions and poor infection prevention and control in a healthcare setting, and perhaps the right environmental factors, occur. 
Dr. MacIntyre compared epidemic curves for SARS and MERS to show that, aside from this year’s March/April hospital outbreaks, the appearance of new MERS cases doesn't follow the same pattern that new SARS cases did. Namely, new MERS cases have continued to appear at a trickle, up until a few weeks ago, whereas SARS disappeared entirely once human-to-human transmission was stopped. One explanation for this is that the Arabian Peninsula has a lot more domesticated camels, which are believed to be the primary host reservoir for MERS-C0V, than China has captive civet cats, which serve as an intermediate host transmitting SARS-CoV from bats to humans. For this and other reasons, there may be a far greater number of opportunities for repeated zoonotic transmission of MERS-CoV than there was for SARS-CoV. In support of this idea, it has been found that those who work with camels are at greater risk of acquiring MERS-CoV than are those who do not.(7) 

In short, MERS-CoV is barely contagious among humans but highly zoonotic, and SARS is highly contagious among humans but barely zoonotic.

All of these considerations are reasons to dissuade one from expecting much overlap between the epidemiology of SARS and that of MERS.   

Dr. MacIntyre's arguments that some features of the MERS outbreak may be specific to the repeated, deliberate release of MERS-CoV are not supported by evidence.

Dr. MacIntyre states that the ongoing MERS outbreak appears to involve "sporadic ongoing infections from a non-human source." We agree, with the caveat that such infections represent a minority of cases; most cases have resulted from short human-to-human transmission chains in healthcare settings.8 Dr. MacIntyre further states that, "Possible sources of ongoing sporadic infection in humans include animals (camels appear the most likely source), or deliberate release." However, she argues that the epidemiological data may be more easily explained by deliberate release than by infections acquired from animal (camel) sources.

The main features of MERS-CoV infections that are suggested in Table 1 of Dr. MacIntyre's paper to distinguish between deliberate and natural infections are the following:

   In support of deliberate release, but not natural infections:
  1. "Evidence of multiple introductions in a single outbreak."
  2. Possibly, "Several cases with no link to human OR zoonotic source."
  3. Possibly, "Multiple genetic strains in a single hospital outbreak at Al Ahsa Hospital."
   In support of natural infections, but not deliberate release:
  1. "MERS-CoV identified in camels."
Below, we respond to each of the features of the ongoing MERS-CoV outbreak that Dr. MacIntyre has suggested provide evidence in favor of deliberate release.

  1. MERS is repeatedly introduced into the human population, most likely because humans are repeatedly exposed to animal sources of the virus.
    While we have yet to see seroprevalence data (though we have on good authority that community seroprevalence is low and a detailed report on the matter will be released soon), no evidence of high population prevalence exists. So far, cases have been sporadic without prolonged chains of human-to-human transmission. Healthcare settings, especially hospitals, have served as both amplifier and nexus for human-to-human spread; approximately 75% of the surge of cases in Saudi Arabia during March-May 2014 are thought to have resulted from human-to-human transmission, primarily in these settings.(9) In fact, many cases initially thought to have been primary, zoonotic cases have subsequently been linked to exposures to confirmed human cases.(8) Also, more than 25% of all cases have been healthcare workers, highlighting the extent of nosocomial (hospital-related) transmission.(8) Moreover, despite Dr MacIntyre’s assertions, a substantial proportion of cases have been mild. Between a quarter (of detections worldwide) and a third (of 113 previously unreported cases announced by the KSA Ministry of Health in early June 2014) were asymptomatic, i.e., they had no notable signs or symptoms of illness.

    However, until a pause this July, new MERS cases have been detected almost continuously at low levels over the past year or more. Aside from outbreaks in healthcare settings, these cases are thought to be by and large primary, zoonotic cases, i.e., caught from an animal source, most likely related to camels. Thus, we agree with Dr. MacIntyre that many MERS cases are likely due to multiple introductions into humans; however, we disagree with the idea that this points more to bioterrorism than to an animal source. Instead, we believe that multiple introductions into humans more likely reflect ongoing exposures to infected animals or contaminated animal products; a lot of camels live in and are also imported into the Arabian Peninsula. It is important to note that multiple introductions into humans have also been observed with other zoonotic pathogens as well, including highly pathogenic avian influenza A (H5N1) virus(10) and avian influenza A (H7N9) virus.(11) Existing health conditions have an impact on disease outcomes in such other zoonotic diseases, too. Repeated introductions of a virus into a human population are not unique to bioterrorism; nature does a very good job of creating confounding epidemiological conundrums that are often made worse by inadequate human responses.
  2. We don't know of a source of exposure for a proportion of MERS cases, but that's probably just because we don't have perfect information.
    Small numbers of sporadic cases have been reported for which no contact with other confirmed cases or animals is known. Dr. MacIntyre suggests that the simplest explanation for these cases may be bioterrorism. In our opinion, however, these cases may be explained most simply by the pervasiveness of incomplete case histories, and occasionally by contact with undiagnosed cases, rather than by the deliberate release, past or ongoing, of pathogens into the environment. Moreover, patients or their relatives may not be aware of all relevant interactions with animals or animal products, and we also may not be asking the right questions about those interactions. We will simply never know about all relevant contacts for every infected person; we never really do for any viral outbreak. MERS is a fairly new disease, and even the experts are unclear about how MERS-CoV is transmitted from camels to humans or even from humans to humans, for that matter. Let's figure out the basics before we say that bioterrorism is a more likely cause than nature.
  3. Genetic variability among different human MERS-CoV variants is small and probably results from natural variability in MERS-CoV; viruses are naturally diverse.
    The fact that multiple MERS-CoV strains were detected in a single outbreak at Al-Ahsa Hospital suggests only that the outbreak resulted from human-to-human transmission of virus introduced via multiple zoonotic events that exhibited some expected genetic variability. Such multiple introductions have been documented and explained already.(12) While it’s possible (though unlikely) that several viral variants were deliberately released, nature is quite capable of doing this without human help.

    Genetic variation among MERS-CoV isolates has indeed been detected in Saudi Arabia. However, the changes have affected <2% of the entire genome, a degree of variation that is not uncommon within other endemic human coronaviruses. Virus variation can also occur among MERS-CoV strains passaged through cells in culture, indicating that virus-driven adaptive changes are not unusual in this virus under a variety of host and growth conditions. Furthermore, the genotypes found in both camels and humans throughout the Arabian Peninsula have generally been no more or less divergent than what we’ve seen in Saudi Arabia thus far. The exception is a strain found in a camel in Egypt that had been imported from Sudan or Ethiopia;(13) this strain is notably more divergent and may hint at an as yet untapped source of variation to be found in geographically dispersed cousins of the Saudi viruses.  Genetic variability occurs naturally among viruses, including zoonotic viruses,(14) and is not a hallmark of bioterrorism.
There are better ways to explain the unusual features of the observed epidemiology of MERS-CoV.

Dr. MacIntyre states, "The continued increase in cases in KSA in 2014, without satellite epidemics in other countries, and without consistent animal contact in all cases is inexplicable." These observations are not inexplicable for a virus that transmits poorly. We argue that satellite epidemics have not been observed simply because secondary, human-to-human spread of MERS-CoV is rare and is, moreover, most likely attributable to a small percentage of cases. We have seen evidence for such inefficient transmission in almost every exported MERS case to date. People sitting next to a confirmed case during tours and on planes have not become ill; nor have they tested positive for MERS-CoV. Apart from weaknesses in the virus and environmental factors (e.g. temperature, humidity, outside camel birthing season), good infection prevention and control may also play a role in limiting spread. 

Dr MacIntyre suggests, further, that, “If the large recent increase in cases in KSA is due largely to person-to-person transmission, other similar increases (satellite epidemics) would be expected in other countries.” However, even though satellite epidemics have not occurred, it is a fact that most cases in the spring in the KSA were due to human-to-human transmission. The healthcare-related outbreak in Jeddah was tied to location-specific failures of infection prevention and control, as the World Health Organization (WHO) has pointed out.(8,15)

As for cases "without consistent animal contact," we hope that Dr. MacIntyre is not expecting proof of animal contact for every case, but rather for suspected primary cases only. As discussed above, most cases have reportedly resulted from human-to-human transmission, and the rest are probably accounted for by incomplete medical case histories and overlooked contacts with an undiagnosed case or infected camel source. Alas, for some primary cases, we simply do not have enough information yet.

The epidemiological data used by Dr MacIntyre, courtesy of the Saudi Arabian Ministry of Health and the WHO, are imperfect. Those of us maintaining MERS-CoV detection line listings are painfully aware of the limitations associated with these data and their communication. Reporting formats have changed repeatedly, resulting in inconsistent case histories. Testing delays, reporting gaps, incomplete case information and translation errors are but a handful of issues that must be considered and controlled for when using these data to improve our understanding of MERS epidemiology.

Yes, there have been seemingly incongruous pauses in case announcements during periods of mass gatherings – times when we might expect detections of a respiratory virus to be on the rise. Yes, it appears, from the data alone, that only a handful of cases have reported animal contact, despite the fact that about 25% of human cases have been zoonotic, according to the WHO.(9) Yes, countries with cases outside Saudi Arabia more often report contact with camels. However, these “paradoxes and inconsistencies” are far more likely due to incomplete and inconsistent data collection and reporting than to a “deliberate release” of MERS-CoV as a putative category C bioterrorism agent.

How likely is it that MERS-CoV is a cultured pathogen deliberately released by bioterrorists?

The likelihood that MERS-CoV was deliberately released in Saudi Arabia is vanishingly small, and Dr MacIntyre’s article fails to provide any sound scientific basis to convince us otherwise. Each of the features of the ongoing MERS-CoV outbreak that she has put forth as an indicator of deliberate release can also occur naturally. In addition to the issues discussed above, Dr MacIntyre offered no explanation to describe a mechanism by which MERS-CoV could have been weaponized; however, given what we do know about MERS-CoV, purposeful weaponization seems highly improbable. Thus, while it is worth considering whether any disease outbreak has a deliberate human cause, Dr. MacIntyre's paper provides no evidence that supports bioterrorism as a cause of MERS. Instead, an abundance of evidence suggests that MERS results from natural causes.

MERS-CoV is known to infect dromedary camels across the Arabian Peninsula and Africa; we likely know of only a fraction of its geographic range in the latter. Moreover, the virus has been in these animals for at least 20 years. As we continue to learn, it’s looking more and more like an ancestor of MERS-CoV first emerged in bats, potentially in Africa.(16,17) If the virus did spill over from bats to camels at some point, it remains unknown when or how, as does the scope of how many other animals carry some version of MERS-CoV-like viruses. 

So, does any of this mean that a deliberately engineered form of the bat virus was purposefully released into camels more than two decades ago? Could it have been a (very poorly functioning) bioweapon intended for use against camels? Who would have created such a weapon? Or, was such a virus potentially introduced into humans first and we’ve been the source of camel infections ever since? Due to the large genome sizes of coronaviruses (the largest among all RNA viruses), reverse genetics systems, used for “made-to-order virus” construction, are quite cumbersome and demanding; only a handful of labs are known to be proficient with these systems. These significant technical requirements provide further evidence against the possibility that MERS-CoV has been used as a bioweapon.

Dr. MacIntyre states that, “when a new infectious disease emerges, bioterrorism, unless it is caused by an eradicated disease such as smallpox, may not be easily recognized for what it is unless we consider the possibility.” This, however, is not supported by the last decade of research and development, undertaken across the world, towards the goal of preventing, detecting, and mitigating the effects of bioterror. Since 2001, considerable resources have been invested in preparing for bioterrorism. This has led to the deliberate and explicit “securitization” of public health and medicine, with a focus on conceiving the potential for human-caused disease outbreaks.(18) The focus on man-made viruses and the potential for bioterror is a multibillion dollar enterprise;(19) if the status of MERS-CoV as an intentional release  agent were plausible, it would provide rare vindication for such efforts. That it has not is not for want of attention on the behalf of policymakers around the globe.

It is also worthwhile to reflect on the reasons one might release a pathogen and how the ultimate goals of any purported bioterrorist might inform their release strategy. The two iconic instances of bioterror—separate from biological warfare—in the twentieth century were the use of Salmonella enterica by the Bagwan Shree Rajneesh cult in Oregon in 1984 and the 2001 anthrax attacks.20 In both, a bacterium was used with very specific goals: the attempted manipulation of a local election and the targeting of US public service institutions. 

A poorly transmitting coronavirus, however, could not be targeted as well as the pathogens used in the above cases. It isn’t an ideal agent for more common attempts to use pathogens as weapons, either, such as the failed attempts to weaponize anthrax and the botulinum toxin by the Aum Shinrikyo doomsday cult.(20) Rather, MERS-CoV occupies a biological limbo in which its effects are too intermittent for it to be a targeted agent, but nowhere near prolific enough to be a means of generating widespread bioterror. If MERS-CoV were to be—counterfactually—a bioterror agent, then its creators would have surely failed at their task. 

We don’t see too many new diseases; there are only so many ways a pathogen can make us sick. In this sense, MERS is not really clinically distinct, and certainly nothing about MERS can be pointed out as pathognomonic; however, there still remains much to learn about the epidemiology, clinical course and virology of the disease. This is quite commonly the case, even two years after the discovery of a new viral species. By all means, investigators should consider all potential causes of outbreaks of new human pathogens, even bioterrorism. However, in the case of MERS, while detailed laboratory, epidemiological and clinical studies are absent or found wanting, the publicly available data that exist are consistent with a natural origin for the outbreak. The simplest explanations are likely still the best; in this case, when we hear hoof beats, we shout camel, not bioterrorist.

References.
  1. MacIntyre, C.R. The discrepant epidemiology of Middle East respiratory syndrome coronavirus (MERS-CoV).
    http://link.springer.com/article/10.1007/s10669-014-9506-5/fulltext.html
  2. https://storify.com/MackayIM/evoking-bioterrorism-as-a-cause-of-sporadic-mers-i/edit 
  3. http://www.who.int/ith/diseases/sars/en/ 
  4. SARS and MERS are the diseases associated with SARS-CoV and MERS-CoV infections, respectively.
  5. http://www.cdc.gov/coronavirus/mers/faq.html
  6. http://www.who.int/csr/disease/coronavirus_infections/MERS_CoV_RA_20140613.pdf?ua=1
  7. http://www.who.int/csr/disease/coronavirus_infections/MERS-CoV_summary_update_20140611.pdf?ua=1
  8. http://www.who.int/csr/disease/coronavirus_infections/MERS_CoV_RA_20140424.pdf?ua=1 
  9. http://www.reuters.com/article/2014/05/14/health-mers-meeting-idUSL6N0O03TQ20140514
  10. http://www.who.int/influenza/human_animal_interface/H5N1_cumulative_table_archives/en/
  11. http://www.who.int/influenza/human_animal_interface/influenza_h7n9/Data_Reports/en/
  12. http://www.ncbi.nlm.nih.gov/pmc/articles/PMC3898949/
  13. http://wwwnc.cdc.gov/eid/article/20/6/14-0299_article
  14. http://www.ncbi.nlm.nih.gov/pubmed/24457975
  15. http://www.ncbi.nlm.nih.gov/pubmed/23891403
  16. Corman VM, Ithete NL, Richards LR, Schoeman MC, Preiser W, Drosten C, Drexler, JF. Rooting the phylogenetic tree of MERS-CoV by characterization of a conspecific virus from an African bat. J Virol. 2014 Jul 16. http://jvi.asm.org/content/early/2014/07/10/JVI.01498-14.abstract
  17. Yang L, Wu Z, Ren X, Yang F, Zhang J, He G, et al. MERS–related betacoronavirus in Vespertilio superans bats, China [letter]. Emerg Infect Dis. 2014 July. http://wwwnc.cdc.gov/eid/article/20/7/14-0318_article
  18. Fidler, David P, and Lawrence Ogalthorpe Gostin. 2008. Biosecurity in the Global Age. Stanford University Press. 
  19. Elbe, Stefan, Anne Roemer-Mahler, and Christopher Long. 2014. “Social Science & Medicine.” Social Science & Medicine, May. Elsevier Ltd, 1–9. doi:10.1016/j.socscimed.2014.04.035.
  20. Wheelis, Mark, and Lajos Rózsa. 2009. Deadly Cultures. Harvard University Press.

Ain't no thing like MERS-CoV, 'cept MERS-CoV...

Probably little obscure if you haven't been fanatically watching every Guardians of the Galaxy Trailer for the past year and a half-but I guess I just like to make you work for it.

What follows tonight (my time) are some further additions to what has become the saga of whether the Middle East respiratory syndrome coronavirus (MERS-CoV) is not a naturally circulating virus, but in fact an engineered or cultured weapon of (very ineffectual) terror?

Not sure if you can guess but I'm in the natural camp.

Last week (was it just last Friday?) I learned of a paper by Professor Raina MacIntyre published in Environment Systems and Decisions.(1) This was thanks to having butted in on a Twitter conversation between Alexandra Phelan, Maia Majumder and Stephen Goldstein. In this paper there was the suggestion that MERS-CoV was deliberately released. This possibility was concluded after applying a risk analysis approach to publicly available data with an aim to "shift the paradigms of thinking about emerging infectious diseases". One of the articles search keywords is Bioterrorism.

A conclusion of s was that "When a new infectious disease emerges, bioterrorism, unless it is caused by an eradicated disease such as smallpox, may not be easily recognized for what it is unless we consider the possibility." Dr McIntyre also wrote a piece for the Conversation (3), multiple pieces for her facebook page (4) and one for the School of Public Health and Community Medicine UNSW.(5) On Twitter, Dr MacIntyre noted...
We aired our surprise about this, as did some others, and things got misquoted...

...and then took a turn away from seeking answers...
For a list of all the Tweets (I believe), please check out my Storify timeline.(2)

So, to share our concerns, we wrote, with the oversight of an expert Editor, a 900-word piece also for the Conversation.(4) Check out its comments for added detail too.

We also wrote a longer piece for this blog, which will follow in the next post.

References...
  1. The discrepant epidemiology of Middle East respiratory syndrome coronavirus (MERS-CoV). http://link.springer.com/article/10.1007/s10669-014-9506-5/fulltext.html#Sec3
  2. A Storify timline of our exchange about the paper in 1.
    https://storify.com/MackayIM/evoking-bioterrorism-as-a-cause-of-sporadic-mers-i
  3. https://theconversation.com/mers-coronavirus-animal-source-or-deliberate-release-29690
  4. https://www.facebook.com/ProfRainaMacIntyre
  5. https://www.facebook.com/sphcmunsw/posts/269065343283155

Tuesday, July 29, 2014

Where has all the MERS-CoV action been...?

Sorry but no prizes to be awarded here.

...the Kingdom of Saudi Arabia is where nearly 90% of all laboratory-confirmed detections of the Middle East respiratory syndrome coronavirus (MERS-CoV) have originated from, as best we can tell. 

This is based on data sourced from the World Health Organization, various Ministries of Health around the world, FluTrackers and the scientific literature. All public data sources. 

While the tally sits around 847 cases and 291 deaths, right now we are experiencing a multi-week lull in new case announcements. Great news for the region and the world, which is dealing with many assaults, biological and otherwise, right now.

Where the wild MERS-CoVs are.
Click on chart to enlarge.