Showing posts with label China. Show all posts

Saturday, July 19, 2014

Now for something (not so) completely different: H7N9 maps...

Now it's time to mess around with influenza A(H7N9) virus mapping using Tableau.

I've (only just) realised the my esteemed peer, Shane Granger has been using Tableau to do this for ages (see here), and that this will be duplicating his excellent work. So I'll try my best to consciously differentiate my maps from his - but there's only so far you can go with that and there will be overlap. 

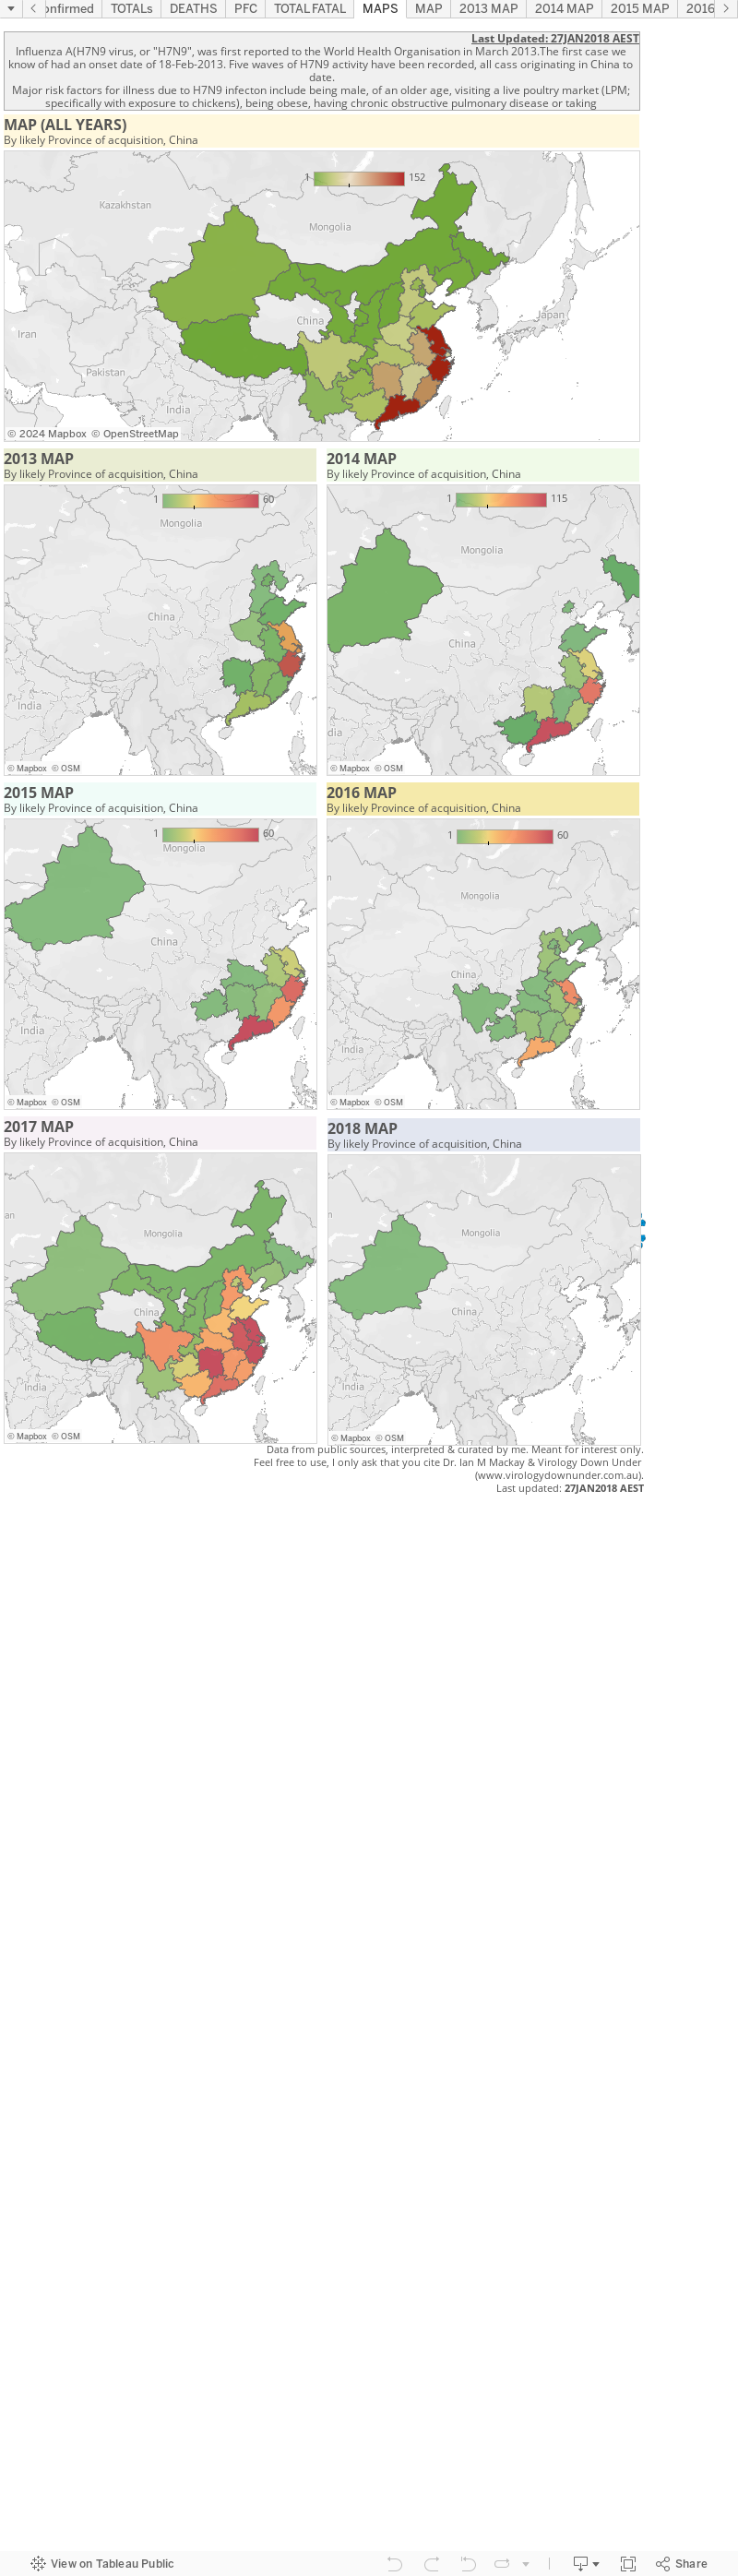
The page below is a very early first play with H7N9. It's just detections broken across 2013 and 2014, by province most likely to have been the source of the infections (as far as I can tell) in mainland China. 

If I can master this I'll try and add more details in the future. For now, these numbers a a little out of date but he trends are similar. This charts 449/452 detections.


Monday, April 28, 2014

H7N9 Snapdate: some quick charts...

Click on image to enlarge.
I don't have a lot of time tonight so this is just a quick post of some updated charts with a few summaries of some key features of the influenza A(H7N9) virus situation in south-eastern China. At writing it was at 432 detections with media reporting 128 deaths

Click on image to enlarge.
Guangdong is where H7N9 is still most active and it is this province that is the source of the continued cases trickling off Wave 2's peak.

Most H7N9 cases overall have been in Zhejiang and Guangdong provinces but lately, post-peak of Wave 2, there has been continued activity in Jiangsu province including a recent healthcare worker with no mention of "contact with poultry"; the absence of which stands out in World Health Organisation (WHO) reports because most cases are followed by affirmation of that phrase.

Click on image to enlarge.

In  the  survival chart above we see that most of the fatal cases, shown in red, are defined by an older age. Unfortunately, a lot more of the fatalities have been reported through the media without identifying details (48 of 128), than have come through official Chinese channels and out via the WHO. This lack of detail makes it impossible to clearly link a lot of the deaths to the case announcements. Only the custodians of these data know what this chart should really look like. NB: Since making the chart this morning I've found a handful more case details at FluTrackers, but public detail on fatal cases remains the weakest of any of the H7N9 data.

Click on image to enlarge.
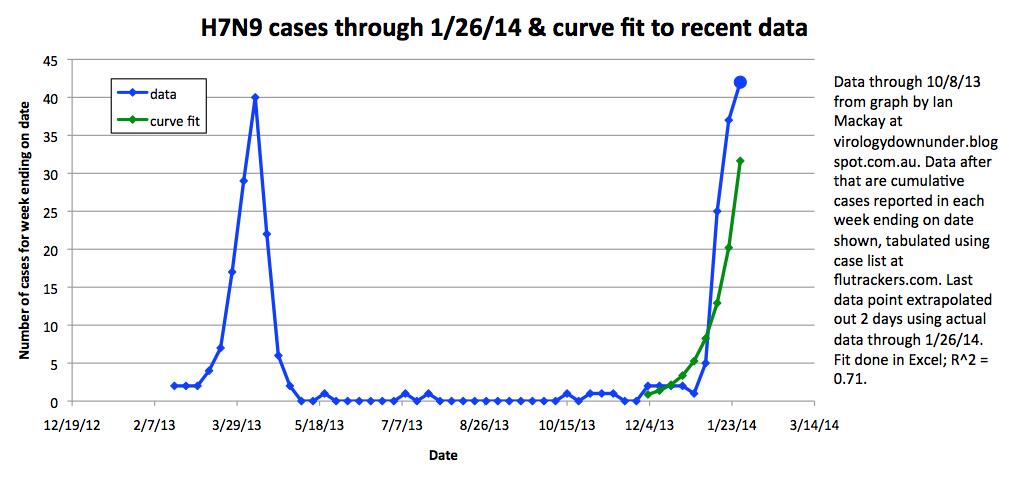
We can see in the weekly chart on the right that the two H7N9 waves differed in timing, the width of their bases (more cases in Wave 2) as well as how "tight" their peaks were. Wave 2 has tailed off, but continues to spit out cases, while Wave 1 comprised both a steep climb and a steep decline in human cases.
Click on image to enlarge.

If we zoom in on Wave 2 we can see by looking at cases per day in the chart on the left, that between 0-4 illness onsets per day are being reported, as they have been since late Feb-2014. 

Is this the legacy of those regions whose live bird markets remained open or were only shut temporarily for disinfecting and restocking? Those regions with markets that were shut for much longer, or for good, do not seem to have contributed much to the continuing leak of H7N9 infections despite being key contributors during the peak periods before markets were closed.

Click on image to enlarge.
In zooming in on Wave 2's cases by week, but this time based on the region of likely acquisition of infection, we see that Guangdong province (brown line) has been the most consistent contributor of human H7N9 infections both late during the 2nd of the Wave 2 peaks, but also after the peak's decline almost everywhere else in south-east China. There was considerable publicised unwillingness from poultry producers to permanently close markets in this Province, a location with a major role in the nations poultry production. And so this little experiment incubates further and I have little doubt we will see the impact of that unwilingness late in 2014. 

Click on image to enlarge.
As noted above, public H7N9 death data do not allow good linkage with official case announcement data for about 48 fatalities, so my second-last chart tonight uses both public and media-release numbers to try and illustrate how the proportion of fatal cases (PFC) has changed across both Waves. The PFC seems to be holding fairly steady now between 17% and 30% (depending on source of numbers).


Click on image to enlarge.
And finally we see that the age and sex distribution across all cases (both Waves) is skewed to wards older males. Same as usual. If we look at this distribution (ran out of time to put in here) for the fatal cases, it is much more tightly grouped around the >60-year olds, but that females appear to dominate males in deaths during Wave 2, whereas it was the other way around for Wave 1.
Saturday, March 15, 2014

H7N9: the dotted lines that make sense of things...[CORRECTED]

Click on image to enlarge.
The latest H7N9 case-per-day chart shows that the trickle of human cases of confirmed avian influenza A(H7N9) virus infection is becoming a drip. The tap? My money is still mostly with the market closures. What precisely in the markets is the source of human H7N9 acquisition? Dunno, but the consensus seems to be poultry; songbirds also look pretty good though. It doesn't have to be, and is unlikely to be, just 1 thing of course. We know that this virus, as with other avian influenza viruses, can be shared around among bird species. It can even go into a human and that isolate be used to infect a bird again. See my recent post on some of this.


Click on image to enlarge.
What's also particularly intriguing, among the many interesting aspects of H7N9's acquisition and spread among humans, is that we're seeing much more "shouldering" in the Wave 2 epidemic curve than we did in Wave 1's.

Instead of the precipitous decline we saw back in 2013, we're seeing a drop down to ~10 cases per day, but then a slower decline the rest of the way. Is this because we started human cases from more sites this time around?; because markets took longer to close after the cases numbers began to climb?; is it related to markets being closed at different times, in different ways, in different locales? Who knows?
Cases by region acquired, per week, with different
 regions highlighted by coloured lines and the 
total case number in the background (grey).
Wave 1 and Wave 2.
Click on image to enlarge.

Dr Katherine Arden suggested I have a look at what's happening in each Province or Municipality and see whether any particular place can shoulder the blame for the shouldering. And that does seem to be the case if you look at the adjacent chart. Guangdong province seems to be the major culprit contributing to the shoulder effect. 


Cases by region acquired, per week, with different
 regions highlighted by coloured lines and the
total case number in the background (grey).
Wave 2 only.
Click on image to enlarge.
In the zoomed-in version that focusses on Wave 2 alone, we can see that the Wave 2 "peak" has in fact 2 peaks; the 1st peak dominated by Zhejiang province cases and the 2nd driven by a surge in Guangdong provincial cases. Guangdong cases took longer to drop away, and are in fact still being reported, possibly because the major poultry markets there were closed later than in Shanghai and Zhejiang province and only temporarily for a clean. Or perhaps the bird outbreak @influenza_bio and I discussed has a source in Guangdong province?

It's all speculation beyond the data we can actually plot.

Monday, March 10, 2014

H7N9 and human infections: not just a paltry matter

Jones and an all-star cast of colleagues from Hong Kong, Shenzen, Beijing and Tennessee have looked at songbirds and their susceptibility to a human isolate (infectious virus recovered from a human case of H7N9 influenza) H7N9 infection (1).

But before I note the good bits of their study, this paper is one of importance for adding a lot to our understanding of how H7N9 is jumping to people from poultry/live bird/wet markets. It's also a great reference if you want to better understand influenza and birds overall. 


We've read much about human cases of this avian virus having had contact with "poultry" and bird markets and  from that we assume that poultry are the pool in which H7N9 is swimming (reservoir); but where did the poultry get it from (source/natural host)? Its also interesting to note that: 
  1. Very few poultry test positive for the virus; may simply be because of a test-based problem including using a test that is insensitive or sampling from the wrong end of the bird (testing the cloaca instead of throat as was discussed ). 
  2. Looking at the sequences of the H7N9 gene segments suggested that wild birds (bramblings) played a part in the evolution of the virus currently infecting humans in south east China (4)
  3. Pigeons have tested H7N9-positive (2,3)
So it might be that at least some of the human exposures are not from poultry but from other birds.

The authors of this latest article note the songbirds are common pets and so are in close contact with their owners. In the wild, such birds are likely to interact with farm birds.

Some key findings of this new study are:
  • A/Anhui/1/2013 was the strain used for H7N9 studies; it was an isolate from a human but early on and similar to bird (6) strains. H5N1 (A/Vietnam/1203/05) and H3N8 (A/songbird/Hong Kong/SV102/2001) were also used for comparisons
  • Zebra finches (Taeniopygia guttata), society finches (Lonchura striata domestica), parakeets (Melopsittacus undulates) and wild-caught house sparrows (Passer domesticus) were kept isolated for 3-weeks prior to experiments to let any naturally acquired infections burn out; none of the birds had antibodies suggestive of previous infection by an H3, H5, H7 influenza A virus (is that low prevalence normal?)
  • Birds were inoculated with 105 50% egg infectious doses of virus via nose, eye and mouth (that should do it) and then put in the same cages, sharing water and food, with uninfected birds
  • Virus testing was by growth using eggs (3/sample collected)
  • All inoculated birds shed virus (only) from the oropharynx; finches shed most virus at 2-days post inoculation (dpi); parakeet viral shedding could be detected by culture for 2-days and from finches for 6-days
  • Communal water troughs yielded culturable virus; zebra finches shed most virus but water consumption and drinking frequency were not measured and may have differed among bird species
  • No virus could be detected at 8dpi
  • 1 sparrow showed signs of disease and died; 1 zebra finch died without signs of disease (some loss of appetite)
  • Birds in contact with infected birds did not often acquire infection but when they did, they also shed via the oropharynx
  • In finches that were killed for organ testing, virus was mostly found in the trachea; some was isolated from brain and eye tissues of 1 society finch and in the small and large intestine and a high titre form the lung of the other. H7N9 was grown from the brain, lung and intestines of zebra finch. H7N9 was not found in surviving sparrow organ tissues; in the dead sparrow, some H7N9 was found only in the lungs
  • Nearly all inoculated birds mounted a specific antibody response to H7N9 after inoculation. Among the contact birds, 3/3 zebra finches, 1/3 society finches (had highest amount of antibody), 2/3 sparrows and 0/2 parakeets mounted a response to virus indicating that they were infected but did not show signs of illness nor did they shed virus, at least at culture-detectable levels
So songbirds, can be infected by a human H7N9 isolate, they can shed the virus into the environment, they can die (presumably) due to H7N9 infection, 33-66% of songbirds in contact with an experimentally infected songbird acquire aninfection (even if it was rare to grow infectious virus from that contact which may be a sensitivity issue of the testing) and they mount an immune response to the infection. Given that H7N9 acquisition seems to be a numbers among humans, this degree of transmission among birds fits well.

It was also very interesting that water troughs often contained lots of shed H7N9 virus. This is not new in the world of influenza virus but its nice to cross the 't' for H7N9. The authors note that studies of transmission from songbirds to poultry via communal water sources are yet to be conducted. Seems like this would be a very important piece of the influenza puzzle and with broad application to future outbreaks and seasonality in birds via migration. 

Add to all of this that songbirds are present in many markets (thanks to @Crof, @Laurie_Garrett and @debmackenzie1 for supporting info via Twitter this morning; also see refs from Jones et al (1) and a related story from New Scientist (8)) and that older males are a key demographic for keeping songbirds as luck-enticing (and cute) pets. They are also over-represented among H7N9 cases (see adjacent chart). A good fit.

Another recent study (7) shows chickens and quail (a possible amplification host helping bridge the gap between wild birds and poultry) shed a lot of H7N9 after experimental inoculation via an intranasal route. Also, quail (but not pigeons) shed enough H7N9, for long enough, to pass it along to their contacts; less so ducks.

None of this may be very new to some of you, but it's nice to see data that confirm it all for H7N9. After all, as someone reminded me recently on Twitter, data is just how we roll.

It's not hard to see the circle of life for influenza viruses is there for the interpreting and that non-poultry birds may be important intermediate hosts of H7N9 and act as a source of other influenza A viruses. 

Just how many human cases of H7N9 are acquired by songbirds vs chickens/ducks/quail/geese remains unquantified....perhaps unquantifiable.

References...

  1. Possible Role of Songbirds and Parakeets in Transmission of Influenza A(H7N9) Virus to humans.
    http://wwwnc.cdc.gov/eid/article/20/3/pdfs/13-1271.pdf
  2. A summary of Influenza A(H7N9) virus findings in birds and humans
    http://virologydownunder.blogspot.com.au/2013/10/a-summary-of-influenza-ah7n9-virus.html
  3. Emergence of avian influenza A(H7N9) virus causing severe human illness - China, February-April 2013.
    http://www.cdc.gov/mmwr/preview/mmwrhtml/mm6218a6.htm
  4. Sunny summer or birds on the wing?
    http://virologydownunder.blogspot.com.au/2013/05/sunny-summer-or-birds-on-wing.html
  5. Origin and diversity of novel avian influenza A H7N9 viruses causing human infection: phylogenetic, structural, and coalescent analyses
    http://press.thelancet.com/H7N9genetics.pdf
  6. Genetic analysis of novel avian A(H7N9) influenza viruses isolated from patients in China, February to April 2013http://www.eurosurveillance.org/ViewArticle.aspx?ArticleId=20453
  7. Role of poultry in spread of novel H7N9 influenza virus in Chinahttp://jvi.asm.org/content/early/2014/02/20/JVI.03689-13.long
  8. Budgies may be behind latest spread of H7N9 bird flu
    http://www.newscientist.com/article/mg22129542.000-budgies-may-be-behind-latest-spread-of-h7n9-bird-flu.html#.Ux5CnvmSx8F

Wednesday, February 5, 2014

H7N9 snapdate: age with time

Click on image to enlarge.
Age groups selected to convey clearest trends
without too many lines.
A quick look at some age bands followed each week during the course of both waves of the avian influenza A( H7N9) virus outbreak.

The interesting line to watch is that of the youngest age group (0-19-years) which has lifted to comprise 50% of cases in the week beginning 27-Jan. Also, the proportion of cases in the oldest age group (70->90-years) has dropped down in the past 2 weeks. 

There have been a rash of children in recent announcements; 8 of the last 45 cases have been <10-years of age. For a virus with a median case age sitting at 58-years, this is quite a departure. 


Is this due to an increase in familial clusters? Does it herald a shift in the way the virus is spreading? Intrafamilial transmission may provide a hint at increasing transmission efficiency. It might also be a sign of increased testing augmenting clinical observation of close contacts of ill family members. 


It bears watching closely whatever is happening because its different for some reason. Also worth watching is the downward creeping age. In 2013 the median age was 55.5-years and in 2014 it is 53.5-years. Among the past 45 cases it sits at 52.0-years


Tonight we have 310 H7N9 cases ( a third in Guangxi province bordering Vietnam has just popped up while I was writing this paragraph and I've altered the numbers above), with at least 50 deaths (that can be accounted for using public data).

Thursday, January 30, 2014

H7N9: Zhejiang in 50 cases...

Click on image to enlarge.
A quick look at the same number of cases (50) during the same period of time (2-months) in Zhejiang province, across 2-years. In 2014, between 23-Nov to 23-Jan, H7N9 case numbers surpassed 50 whereas in 2013 H7N9 cases did not reach 50 during the 1st wave.

Back on the 23-Jan it did not look like it would make it. Things move fast in influenza-town and prediction is a mug's game.

All a bit arbitrary, yet it is another indicator in addition to starting earlier and from more provinces than in March 2013, that H7N9 case numbers will be higher in 2014 than we saw last year and may well tear through the human case tally for that other "bird flu", H5N1.


As @influenza_bio noted on twitter this evening, there have been a lot of farmers listed in the FluTrackers case list of late.

A quick tabulation shows that 9.5% of FT cases between #1 & #137 have "farmer" in their description while none do between #139 & #177. However, 33.3% of the cases between #178 & #274 are described as farmers. What type of farmer, and how thoroughly this description was initially reported in the provincial media release is completely unknown so take this paragraph with a big grain of chicken salt.

There have been 6 new H7N9 cases added tonight, so far including 2 deaths, one among the new list and 1 of a previously reported case.

Wednesday, January 29, 2014

H7N9 snapdate: new charts for sex and age distribution and region of acquisition...

Two new charts.


Click on image to enlarge.
Firstly, the "age pyramid", a revised and combined version of the age and sex distribution charts for 265/267 H7N9 cases to date. This one comes with many thanks to Shane Granger for helping me learn a new trick. Please follow him @gmggranger or visit his chart-tacular blog, Random Analytics at http://gmggranger.wordpress.com/.


Secondly, we have the latest map of the H7N9 hotzone; adjusted to account for Zhejiang tipping over the 100 cases mark (new colours!), and for the addition of a new province into the world of H7N9 human infections; Guangxi. This marks the first new region and 13th to generate cases overall, since 9-Aug-2013. 

H7N9 has thus crept sideways towards the west and as FluTrackers noted, Guangxi shares a border with Vietnam. An entire other country. The first shared land border since we learned of H7N9 I think. I'm no expert in this topic, but trade in poultry and tourists between these two regions seems commonplace, as noted here, here and to the extent that research such as this study (and its references) indicate H5N1 sequences are shared between the regions.

Do we know if Vietnam actively employs laboratory methods to screen poultry for H7N9, H9N2, H10N8 screening of their birds? I suspect we'll learn soon if not.

Monday, January 27, 2014

Influenza H7N9 in the news....

Some snippets of information about H7N9 from China in recent releases include:

  1. The description of H7N9-induced disease has changed in 2014 from an "infectious disease" to a "communicable acute respiratory disease". For what that's worth.
    Still technically infectious, just more about what sort of disease.
  2. 7 patients have died with H7N9 infection in 2014
  3. The incubation period for signs and symptoms to develop after H7N9 infection is 3-4-days; if patients develop severe pneumonia, it will be 3-7-days after signs and symptoms begin
  4. Chinese Vice Premier Liu Yandong said
    "China will strengthen monitoring on live poultry, continue vaccine research and development, tighten international communication and cooperation in epidemic prevention and control, and publicize disease information in a timely manner"
  5. "DNA rapid tests" (PCR-based) suggest a batch of chickens being imported into Hong Kong from Foshan, Guangdong may be H7 positive. H7N9? Further testing is ongoing. [Update - looks like they were POS as Hong Kong has suspended imports and will cull 20,000 chickens already there]
  6. 12 cases in Zhejiang province have died from H7N9 in 2014 alone! I have 2 listed. 7 in total 2014. Looks like we've lost traceability on the numbers again.
Sources...

Sunday, January 26, 2014

Zhejiang: more live bird market closures...

FluTrackers have posted a report originating from the Ningbo evening news in China stating that more markets in Zhejiang province, in the regions below, have been closed for cleaning and disinfection in an attempt to bring the Province's H7N9 outbreak under control...

These regions have already suspended trading...
  • Hangzhou city (which I noted here)
  • Xiaoshan District
  • Yuhang District
  • Jinhua
  • Shaoxing City
This new report notes closure of the following markets in the "main city of Ningbo" from 26-Jan..
  • Haishu District
  • Jiangdong District
  • Jiangbei District
  • Yinzhou District
Exotic bird imports and pigeon flying has been banned.

H7N9 Welcome to Week #50....

Media preview
Chart of weekly cases from @influenza_bio

Let's play duelling charts!! My colleague on Twitter, @influenza_bio, (whom you should follow if you are not already - he's got a knack for (a) getting across some nice flu-facts in a easy-to-understand way and (b) he rants - who doesn't like a ranter!?! That sounded less weird in my head.

Today's chart update from me shows the avian influenza A(H7N9) virus weekly and accumulation case chart. In case I haven't mentioned this lately, the human cases of infection by this newly emerged (in humans) virus is all from south eastern China. 

Given that cases keep on coming, this chart has changed a lot in a few days. The last chart is now already 4-days old. Ancient. See it here.


Click on image to enlarge.
My latest chart lists 246 cases and is based on the FluTrackers curated list (to be found, and checked regularly, here) and includes all recent WHO update information which provides some extra details - including date of onset of illness and hospitalization since late October. WHO has a few cases to catch up on.

These are useful additions since cases can be noted in the media or by the relevant ministries or public health institutions many days after the illness manifested in the patient and even after they were admitted to a hospital, usually in pretty poor medical condition. 1 more was added form Jiangsu last night that missed those charts.

I've arbitrarily listed the 2 "Waves" of H7N9 cases - if there is an official designation for dates, I'd be happy to hear of it.

Wednesday, January 22, 2014

H7N9 infection of women is not on the rise....

Click on image to enlarge.
A bit over a week ago I posted a chart showing that the proportion of females with avian influenza A(H7N9) virus may be rising.

We've had a lot of cases since then so is that trend still holding? 

[By the way, you are forgiven for  thinking this is the "H7N9 Down Under" blog!]

The new chart shows that the proportion of females has dropped back to something looking a little more like it did in 2013. The earlier data seems to have been a blip after all. 

With the addition of new cases to the dataset and with the shifting and re-sorting of cases into this or that week as onset data firm (WHO have recently been doing a fantastic job filling in the data gaps from Chinese reports), we can see that the proportion of females has been 40% or (often much) less each week for 10 of the past 14 (71.4%) weeks.  

In summary...

  • The current proportion of female confirmed H7N9 cases overall is 29.5% (219/220 cases with data) 
    • In 2013, females comprised 29.7% of cases
    • In 2014 females comprise 29.5%. No difference to speak of.
So males dominate among the mostly severe human cases of H7N9 infection; business as usual for H7N9. 

Also, sustained person-to-person transmission (infected person passing to another  person, (1st round; = sporadic transmission) who passes it to another person (2nd round) and so on...is not happening.

Thursday, January 16, 2014

Tracking virus-related deaths using publicly available data...

Click on image to enlarge.
Here's the cumulative case chart overlaid with the cumulative deaths and PFC. see the story behind the term PFC here, created by VDU to avoid issues around case fatality rate/ratio (CFR) which relies on knowing when cases have recovered.

I have two PFC values charted here. In black dots, is my curated list based on fatal cases (n=40; red dots) that have been announced publicly. 

In yellow are the numbers gleaned from media releases and the WHO - the latest number being 52 fatal H7N9 outcomes. 

Somewhere towards the end of the initial H7N9 outbreak in May, we stopped seeing reports from China that could link fatal cases with those H7N9 cases they initially announced. If anyone knows of a complete public list of fatal H7N9 outcomes that contains all 52 cases with age/sex/date of illness onset/date of death/province, I would be most grateful to be made aware of it.


Wednesday, January 15, 2014

A quick comparison of the rate of H7N9 case climb over different 2-month periods...

Click on image to enlarge.
While there has definitely been a lot of H7N9 human case activity centred around Guangdong province of late, but how does it compare with the 2013 H7N9 hotzones of Shanghai, Zhejiang province and Jiangsu province? 

This rough comparison of a 2-month period uses the same y-axis (50-case maximum) encompasses the most active periods of case announcements. It shows that the Guangdong province case tally has not risen to the same peak in the same period as the other 3 regions in 2013. With 2 new Guangdong cases announced this evening (my time) and a Shanghai case, all in males, it will be interesting to watch this ascent.

H7N9 cases now at 182, 52 (28.6%) fatal.

Tuesday, January 14, 2014

Things I did not know #125,326...H5N1 is enzootic (=endemic in animals) in some countries...

Makes perfect sense of course, I just hadn't seen that in print in my short time looking at flu.

Helen Branswell has a piece on CTVnews about the Canadian H5N1 cases, noting that the genome will be deduced and submitted to the GISAID database.

So officially, H5N1 is considered enzootic in poultry (endemic for animals) in at least 6 countries (circulating, or epizootic, in at least 9 others):
  1. Bangladesh
  2. China (since 2003) 
  3. Egypt
  4. India
  5. Indonesia
  6. Vietnam

Further reading and references...

  1. http://www.cdc.gov/flu/news/first-human-h5n1-americas.htm
  2. http://www.cdc.gov/flu/avianflu/h5n1-animals.htm

Monday, January 13, 2014

H7N9 age with time: is a younger adult demographic emerging this time around?

This is a big graphic - sorry for that - but I thought it best to show the distribution of age bands (this is updated from the paper I co-authored recently with Joseph Dudley) alongside the shifting age in total numbers and proportion of cases each week. The data are all publicly sourced and verified against the WHO and scientific literature whenever possible and of course, against FluTrackers excellent case list.

1 case is lacking age data.

The chart below (click on it to enlarge and see much more clearly) then some comments underneath. Keep the previous sex/week chart in mind (it's trend has not changed much with the latest cases; these charts also result from a question from CIDRAP's Lisa Schnirring last Saturday) when looking at this. Is any effect seen below due to the increased female representation?


Click on image to enlarge.
It's probably more technically correct to use a line graph for (c) 

since a linked line implies that we know what happens in between 
each data point, but bars just don't show up clearly enough.

  1. The median age of all H7N9 cases (surviving and fatal) is currently at 59-years; the mode is at 54-years.
  2. The median age since Week 33 (see earlier post for why this number) is 54-years whereas from Week #1 to Week #32 it was 60-years. Is this a significant lowering of the median age in wave 2 or just because we're coming into Marc-April, where things may even out?
  3. 74% of all cases are aged 40-years or older (M:F 1:2.36); 48% are 60-years of older (M:F 1:2.23); 6% are 20-years or younger (M:F 9:1)
  4. The age band graph (a) looks very similar to that which we published in late 2013 using 136 avian influenza A(H7N9) virus cases (not at 175 cases)
  5. The total numbers in graph (b) show that patients 20-years of age or younger have not yet shown up among the new wave of H7N9 cases, and if we look at the proportion of each age band each week (c), we can see that a younger than 60-year old demographic is predominating from December, as it did back in March and April 2013.

Saturday, October 26, 2013

Influenza A(H7N9) vaccine approved by Chinese food and drug administration for use...[UPDATED]

CNTV English language newshour reports that the home-made first influenza vaccine from China has met local safety standards and is ready for mass production. The vaccine was a collaborative development between the First Affiliated Hospital under the School of Medicine of Zhejiang University, Hong Kong University, Chinese Center for Disease Control and Prevention, National Institute for Food and Drug Control, and Chinese Academy of Medical Sciences.

It will be interesting to read about what the virus is comprised of (seems to use the older influenza PR8 strain as a backbone, employing a reverse genetics approach to add in H7N9) and how the vaccine makers got around H7N9's predicted low immunogenicity issue, what the dosing regimen is and what was used as adjuvant (mentioned here, earlier). As Mike Coston notes on Avian Flu Diary, the announcements don't detail much of the preceding safety trials that should have been carried out for a vaccine to have reached this level of development. 

Mike has an earlier post over on Avian Flu Diary that reminds us about the few that are sick enough to be obviously ill....and perhaps the many that do not seek medical attention because infection resulted in relatively mild disease. Largely, as Mike notes, any numbers assigned to infections that result in milder or even asymptomatic disease are guesstimates for now - at least until some actual testing is reported. History supports that mild infections are likely, but every zoonosis is its own beast.

More coming soon on the vaccine's development path and on testing to understand H7N9's reach.

Thanks to @makoto_au_japon for identifying the vaccine story through Twitter

Thursday, October 24, 2013

Influenza A(H7N9) in Zhejiang, Dutch DURC and dogs..

With the second H7N9 case (see FluTracker's thread) in Zhejiang, located only 13km from the earlier case, things seem to be picking up where they left off in late April. Poultry exposure seems key to this latest case who was a farmer who engaged in poultry trading. That word, trading, also sparks concern. It suggests that the farmer was exposed to poultry coming from, or going to, somewhere else. H7N9 is on the move. Both patients are very unwell.

Zhejiang province had the steepest rate of case acquisition back then and reached the highest H7N9-confirmed case number as well. 


Looks like this province is going to be a key battleground for the next wave of H7N9.


Meanwhile, Eurosurveillance continues its fantastic coverage of this and the Middle East respiratory coronavirus  and H7N9 outbreaks. It already has a paper online (less than a week turnaround) of the earlier Zhejiang H7N9 case in a 35-year old male (35M) which includes a note about the subsequent Zhejiang case! Outstanding work to the researchers and the publishing team. Quality publication almost in the time it takes to write blog post!


This journal certainly highlights how quickly detail research results and analysis, when submitted to peer review, can be published. 


Click to enlarge. The laboratory turnaround
times for H7N9 detection (where suitable date
data exist) since the outbreak began in early 2013. 
  • 35M was identified though the surveillance system for unexplained pneumonia
  • He was not a farmer and had not had close contact with another probable case. The laboratory turnaround times on this case was 7-days. A 2.2 day improvement on the rolling average I stopped calculating May 6th.
  • The most likely source of exposures was a trip to rural region of  Ningbo city where he may have been in contact with animals. But that was 10-days prior to onset which would make it a long incubation period. 35M remains unconscious so further detailed tracking of exposures is not possible
  • The virus was >95.5% identical to H7N9 from earlier in the year but with 5 hitherto unreported mutations in the neuraminidase (NA) gene. 2/9 bird market samples were also H7N9 PCR-positive but could not be sequenced due to low viral load
Meanwhile, Reuters reports on Albert Osterhaus and Ron Fouchier at the Erasmus Medical Center who are firing up the "gain-of-function" studies to look at what would be required for H7N9 to become a pandemic virus; essentially changing the virus to look for increased transmission. This work will be performed in an highly secure, enhanced biosafety Level 3 lab. Which of course doesn't change the subject matter - but does define how difficult it would be for that to escape. It's not convincingly clear why this virus needs to be given an evolutionary push, rather than "reverse-engineering" those influenza viruses that have previously been pandemic viruses - or some other approach with less risk of creating a virus that if it escaped, would cause a pandemic. Well, to me at least...but I'm no flu expert. You can find much more on dual-use research of concern (DURC) in Laurie Garrett's latest writing over at Foreign Affairs.

And to add to general influenza virus concerns, Sun and colleagues report in Infection, Genetics and Evolution, that infectious H9N2 (isolated using embryonated chicken eggs), strains of which has been implicated in providing genetic material to H7N9, can be isolated from dogs. The isolate was called A/Canine/Guangxi/1/2011 (H9N2). Between 20% 45% of dogs were found to be antibody-positive to H9N2. A range of dogs seem to have been virus-positive with signs and symptoms including loss of appetitie, cough, sneeze, nasal discharge and raised temperture. Some were asymptomatic. Cats next please?

Thursday, October 10, 2013

Low transmission potential for H7N9 that was....remains to be seen what will be

Chowell and colleagues mathematically model influenza A(H7N9) virus transmission in a new article in BMC Medicine.

They conclude that the basic reproduction number (R; the average number of new cases arising from each exiting case) remained much less than 1 (0.1) for H7N9 infections, indicating the virus from earlier this year did not have pandemic potential. I guess we also know that now because we're not the midst of a pandemic. Good test of the model I guess.

The authors note that their...


..very generic model only requires information on the date of symptoms onset and could be applicable to a variety of emerging infections that include spillovers from a putative reservoir and human-to-human transmission.

Unfortunately, one need only look at the MERS-CoV data to see that those dates can be as rare as hen's teeth (pardon the avian pun) in some instances. Models are wholly reliant on good data.

The authors link the decline in the H7N9 outbreak principally to live bird market closures; but if those controls are relaxed (as they have been, I believe)....we hold our breath to see what re-emerges as the weather turns colder, birds intermingle and humidity changes. If indeed any of those things are what might lure out a new round of animal-to-human infections.

Avian influenza A(H7N9) virus re-emergence risk factors...

Hard to believe it was over 6-months ago that we heard so much about H7N9. Papers are still coming out thick and fast describing all manner of aspects of the virus, its impact, transmission and ways to intervene in its replication.

There have been no new cases reported since July and the tally remains at 136 (including Taiwan case) with 44 deaths.

In a recent article in Scientific Reports, Fang and colleagues from China look into risk factors. 

It's hard to know how broadly applicable these data can be given the massive area and population covered and the relatively few cases identified.

Nonetheless the authors main predictors of re-emergence of H7N9 infections in humans are:
  1. Poultry markets and their environments
  2. Human population density
  3. Irrigated lands (exposed to waterfowl; carried by waterfowl)
  4. Built-up areas (see #2)
  5. High humidity
  6. Temperature around 15°C (citing drop in cases with rise in temperatures)

Monday, September 16, 2013

The Rubik's cube of influenza A genes spins up a new lineage of H7N7

Click to enlarge. A (very) summary view of the latest
contributing influenza viruses that precedes the emergence of
human infections with influenza A(H7N9) virus
in south-east China in 2013.
Lam and a global host of collaborators, writing in Nature on the 21st of August, have identified a previously unknown influenza A(H7N7) virus line circulating in chickens. The authors indicate that more influenza viruses lurk among poultry and that active surveillance is needed. This report comes from testing 1,341 pairs of oropharyngeal and cloacal swabs and 1,006 faecal and waters samples from live bird markets (LBMs) in Wenzhou and Rizhao of Zhejiang province, as well as Shenzhen from Guangdong province.


In a complex alphabet soup of influenza A virus findings, the authors, sequenced 34 H7N7, 4 H7N9 and 19 H9N2 egg-isolated viruses but also found H7N2 and H7N3 in ducks. Animals tested were chickens, ducks, geese, pigeons  partridges and quail.

The authors note that rather than wild birds from Europe and Korea, the neuraminidase (NA or N) gene segment from H7N9 is more temporally related to those from H11N9 and H2N9 found in wild birds (wild water fowl, Northern shoveller and common teal) in Hong Kong during 2010-11 with links to domestic ducks in China prior to the H7N9 outbreak this year. Overall, domestic ducks proved to be an important mixing pot between wild birds and chickens.

And it's not just H7N9; the H7N7 found in chickens reminds us that the colours on the cubes are many and are in constant motion. These virus may become/may already be enzootic (endemic in non-humans) and so continuing exposures to live poultry in markets and backyards remains a continuing source of risk for new zoonoses.